
 |
||||||||||||||||||||||||||||||
|
Items 393-399 out of 846 displayed. << [1-7][8-14][15-21][22-28][29-35][36-42][43-49][50-56][57-63][64-70][71-77][78-84][85-91][92-98][99-105][106-112][113-119][120-126][127-133][134-140][141-147][148-154][155-161][162-168][169-175][176-182][183-189][190-196][197-203][204-210][211-217][218-224][225-231][232-238][239-245][246-252][253-259][260-266][267-273][274-280][281-287][288-294][295-301][302-308][309-315][316-322][323-329][330-336][337-343][344-350][351-357][358-364][365-371][372-378][379-385][386-392][393-399][400-406][407-413][414-420][421-427][428-434][435-441][442-448][449-455][456-462][463-469][470-476][477-483][484-490][491-497][498-504][505-511][512-518][519-525][526-532][533-539][540-546][547-553][554-560][561-567][568-574][575-581][582-588][589-595][596-602][603-609][610-616][617-623][624-630][631-637][638-644][645-651][652-658][659-665][666-672][673-679][680-686][687-693][694-700][701-707][708-714][715-721][722-728][729-735][736-742][743-749][750-756][757-763][764-770][771-777][778-784][785-791][792-798][799-805][806-812][813-819][820-826][827-833][834-840][841-846] >> USDJPY: Intraday Movement Indicates A Three Wave RetracementTop ↑ 
November 21 2016 On the 1h chart of USDJPY we are observing a higher degree impulse taking place, that can be near completion at the start of this week, as all five needed waves can be counted from Nov 08 low. If that is the case, then we should be aware of a minimum three wave a-b-c set-back, ideally back to a support seen around the area of a former wave iv, at 108.52. Break beneath the lower channel line can put more bearish pressure in motion. Divergence also suggests that upside can be limited in the very near-term. But don't get us wrong; generally speaking we are bullish USD, but observing few pairs and waiting on retracements to join the trend. For our taste current price of USDJPY is just too high to get long here. USDJPY, 1H 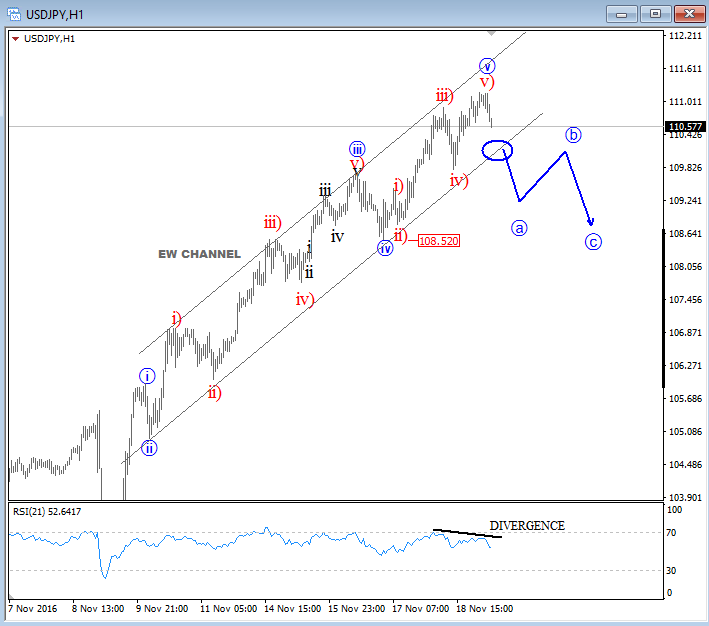
USDCAD: Bearish H&S Near CompletionTop ↑
November 16 2016 USDCAD has reached important level at 1.3500-1.3600 from where we may see a strong drop, especially if we consider a three wave rise from May 2016 low and an ending diagonal in wave "c" position of that same recovery (EW chart is available only to members). So you also see some important evidences of a turn? Grega
VIX-Fear Index At ResistanceTop ↑
November 04 2016 This week I received an email from a client yesterday, asking me if I can post analysis on VIX (CBOE MARKET VOLATILITY). It's an important market that gives you an idea how much fear is involved during volatile markets, especially when stocks are trading down like for the last few few weeks. Well, what is interesting to me is that this stock market is selling off sharply ahead of an important US elections, but event like this can be a trend changer. In other words, they can cause some reversals since I believe that flows will change. Simply put, investors will adjust their positons which may have an impact on price moves. So if trend will change on stocks, then this will be from bearish to bullish mode.
Those who follows me closely will know that I am tracking final stages of a corrective retracement on S&P500 from August highs. It’s a three-wave decline at the moment, so technically I would be expecting a bounce towards the end of the year. And if I look on daily chart of VIX (CBOE MARKET VOLATILITY), then we can also say that price is in final stages of a current corrective structure, thus it also suggests a turn down, ideally from around 22-25 area. Pattern on VIX tells me that next important leg will be lower which is obviously matching with our count on stocks. Also, lets also not forget to mention an important trendline resistance on VIX, connected from 2016 highs. Grega
Price Personality On German DAX Is Pointing HigherTop ↑
October 10 2016 Two weeks back German DAX turned up strongly from 10173, clearly with an impulsive price action so we see it as wave 1 that is part of a bigger bullish cycle. As such we think that strong uptrend will continue soon, as we see current retracement down slow and overlapping; probably wave two within uptrend that can look for a base at 38.2-61.8% Fib. level. For more detail please check our video below.
Boring Triangle On EURUSDTop ↑
October 05 2016 EURUSD remains slow in contracting sideways price action which we see it as a triangle. Based on subwaves and time, we think breakout of a range may occur by the end of the year. Ideally it will be to the downside but would need to see broken wave D swing low to open door for much lower levels. Before market turns south, price may see 78.6% at 1.1400-1.1500.
Oil and CAD Are Bull While Dollar is a FoolTop ↑ Our Services Video Tour | Subscribe to our newsletter September 28 2016 Anyone who is trading crude oil or USD/CAD should be aware of the important correlation between them. We know that if oil price rises then the Canadian economy benefits as they own considerable oil reserves (third only to Venezuela and Saudi Arabia). Furthermore, let’s not forget that the USD will likely drop in value if oil prices rise, and this makes USD/CAD a very interesting pair to trade in connection with energy. So if you are looking for a trade on USD/CAD or crude oil you should be tracking both markets to make sure that your views are matching. If you are looking to short USD/CAD then you want to see higher oil, and vice-versa. Charts don’t lie, so it’s not a bad idea to make a comparison from time to time between oil and USD/CAD, like we do below. .png) In the above chart the negative correlation is clearly visible, and what we really like is the strong decline on USD/CAD and matching bounce on oil at the start of 2016. Technically speaking it looks like a strong first leg that belongs to a bigger structure. From an Elliott Wave perspective (which is my primary tool for analyzing markets) USDCAD has five clear waves of decline from 1.4680 to 1.2455. In Elliott Wave terms that’s called an impulsive wave which is strong and most important evidence for a change in trend; in our case from bullish to bearish. It’s also very important to know that impulses are part of a bigger structure, so even if the decline from that 1.4680 high is going to be just one big correction you still need more downside. Corrections are always structured by a minimum of three waves such as A-B-C. That said, we think that the current recovery from 1.2455 is temporary, labeled as wave B or 2, especially if we consider a triangle in the middle of a current three wave bounce from 1.2455. Why is the formation of a triangle important, you ask? Because they never occur in wave two position of an impulse, but they will normally show up prior to the final wave within a larger sequence. In that case the current blue wave C (circled) is our final wave of a larger 3-leg structure so a bearish reversal may not be far away. Technically there is room for 1.3500-1.3700 to complete a recovery based on Fibonacci levels. .png) Having said that, we think that the upside on USD/CAD will be limited which means that traders should be prepared for a bearish turn in the weeks ahead. This is also supported by a bearish Head and Shoulders pattern that may currently be in its late stages (weekly chart). H&S patterns are one of the most powerful technical formations and an old-school approach when it comes to identifying topping or bottoming formations. .png) So, going back to the OIL/CAD correlation we can assume that oil should rise if our bearish analysis on USD/CAD proves to be correct. On the crude oil monthly chart we can observe a big three wave drop from the 2008 high that should lead to a reversal (i.e. continuation of the main trend), but as always we need to focus on minimum expectations only. So technically the price may go back to 63.20 after a break out of the downward channel from 112.00 and this is supported by a bullish (inverse) H&S pattern on the weekly chart. .png) .png) Considering the charts depicted above I clearly expect higher prices on Crude oil, while at the same time I expect USDCAD to resume its downtrend later this year. Trade well, Grega Horvat .png)
EURAUD Update II: Bears Are BackTop ↑ Our Services Video Tour | Subscribe to our newsletter September 21 2019
Two weeks back or so we were bullish on EURAUD (see it here) and called that leg up which proved to be wave C that completed a bigger three wave recovery at 1.5095. From there market came down very aggressively, but with fifth wave trading now at some significant Fib. level that can cause a temporary upward correction. As such, any shorts can be safer from higher levels than from here... I am waiting on FED today anyhow, and then lets see what price action brings. Grega 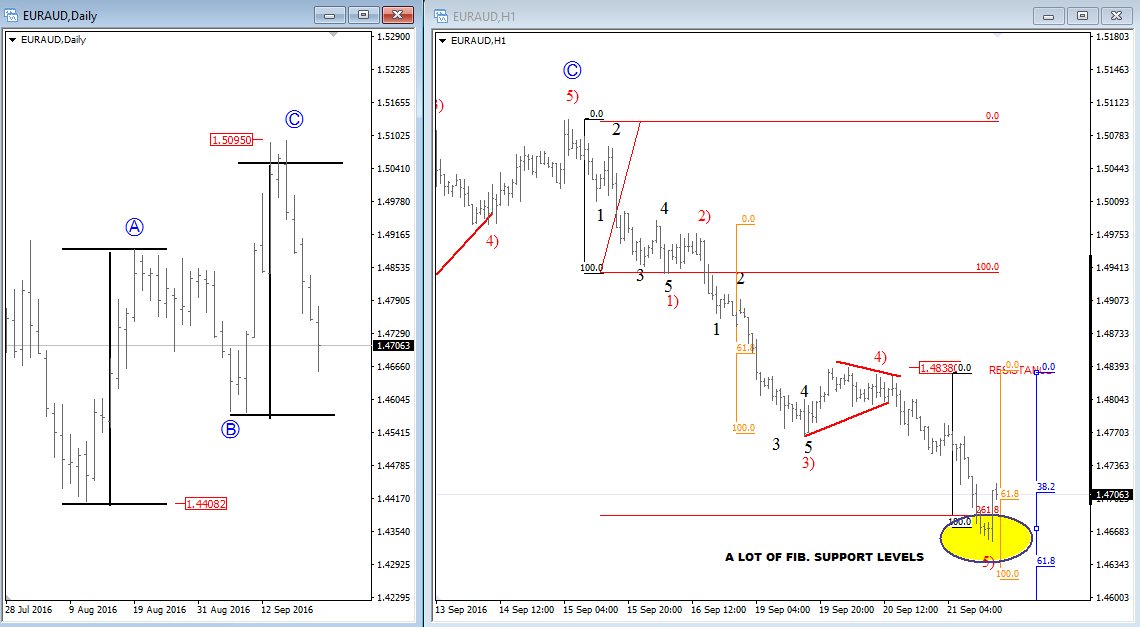  << [1-7][8-14][15-21][22-28][29-35][36-42][43-49][50-56][57-63][64-70][71-77][78-84][85-91][92-98][99-105][106-112][113-119][120-126][127-133][134-140][141-147][148-154][155-161][162-168][169-175][176-182][183-189][190-196][197-203][204-210][211-217][218-224][225-231][232-238][239-245][246-252][253-259][260-266][267-273][274-280][281-287][288-294][295-301][302-308][309-315][316-322][323-329][330-336][337-343][344-350][351-357][358-364][365-371][372-378][379-385][386-392][393-399][400-406][407-413][414-420][421-427][428-434][435-441][442-448][449-455][456-462][463-469][470-476][477-483][484-490][491-497][498-504][505-511][512-518][519-525][526-532][533-539][540-546][547-553][554-560][561-567][568-574][575-581][582-588][589-595][596-602][603-609][610-616][617-623][624-630][631-637][638-644][645-651][652-658][659-665][666-672][673-679][680-686][687-693][694-700][701-707][708-714][715-721][722-728][729-735][736-742][743-749][750-756][757-763][764-770][771-777][778-784][785-791][792-798][799-805][806-812][813-819][820-826][827-833][834-840][841-846] >> |
New York time: 00:00:00
Local time: 00:00:00
| E-mail: | |
HOME
MEMBERS
SERVICE
NEWSLETTER
ELLIOTT SCHOOL
CONTACT
.png)
.png)
.png)
DISCLAIMER
Any reviews, news, analysis, prices or other information contained on our website is provided as general market commentary and delivered electronically through distribution channel to larger number of clients, therefore does not constitute investment advice or investment research. We are not trading advisors. Most of our work is for educational purposes only, with information based on Elliott Wave theory in real time.
Trading forex, futures, options, stocks, cryptocurrenices or any another trading market carries a high level of risk, and may not be suitable for all investors. The possibility exists that you could lose some or all of your initial investment; therefore you should not invest money that you cannot afford to lose. Our website and the information that we provide should not be relied upon as a substitute for extensive independent research before making your investment decisions. In no event will we be liable for any loss or damage on your account in connection with, the use of our products. For any real cash investments you have to contact your financial advisor.
Any information or material contained on our website is owned by Val Global d.o.o.. Reproduction is prohibited without our permission.
Val Global ltd, Dvorjane 7, 2241 Sp. Duplek, Slovenia
| Members area Newsletter |
Services FAQ |
Terms And Conditions Privacy Policy |
||
©2010 - 2020 ew-forecast.com
Design: VOBI