
 |
||||||||||||||||
|
Items 386-392 out of 846 displayed. << [1-7][8-14][15-21][22-28][29-35][36-42][43-49][50-56][57-63][64-70][71-77][78-84][85-91][92-98][99-105][106-112][113-119][120-126][127-133][134-140][141-147][148-154][155-161][162-168][169-175][176-182][183-189][190-196][197-203][204-210][211-217][218-224][225-231][232-238][239-245][246-252][253-259][260-266][267-273][274-280][281-287][288-294][295-301][302-308][309-315][316-322][323-329][330-336][337-343][344-350][351-357][358-364][365-371][372-378][379-385][386-392][393-399][400-406][407-413][414-420][421-427][428-434][435-441][442-448][449-455][456-462][463-469][470-476][477-483][484-490][491-497][498-504][505-511][512-518][519-525][526-532][533-539][540-546][547-553][554-560][561-567][568-574][575-581][582-588][589-595][596-602][603-609][610-616][617-623][624-630][631-637][638-644][645-651][652-658][659-665][666-672][673-679][680-686][687-693][694-700][701-707][708-714][715-721][722-728][729-735][736-742][743-749][750-756][757-763][764-770][771-777][778-784][785-791][792-798][799-805][806-812][813-819][820-826][827-833][834-840][841-846] >> EURGBP Can See More Upside In the Near-termTop ↑ 
March 20 2017
As Elliott wave analyst we have to recognize clear patterns very quickly; we know that sharp moves are impulses, while slow are corrections. If we take a look on EURGBP hourly chart then we can clearly say that decline down from 0.8780 region is slow and overlapping, therefore a corrective set-back that is pointing higher. We see it as wave four which normally finds the base near the area of a former wave four, and around 38.2%. This is exactly where markets is at the moment, so technically next reaction can be to the upside, above 0.8800 for wave five, while market is trading above red wave i) swing high. Rise and break above 0.8740 will suggest that we are on the right track with the count. EURGBP, 1H
.png)
USD Index Out Of Bearish ChannelTop ↑
February 13 2017
Last week market seen some dollar strength against other currencies, but the move is not that strong yet. However, USD index traveled out of a 30 day downward channel which could finally put the buck back into bullish mode, within a context of a strong uptrend on higher time frame charts. As such, we think that USD could outperform other majors this week, even some commodity currencies such as NZD, while AUD and CAD could actually act quite well if oil and metals will continue to rise.
if you are interested to see which markets we track on a intraday basis for potential USD set-ups in combination with the Elliott Wave principle, then try our service of only 1€ and get full package for 14days. .png) EURUSD and USDJPY Intraday Video Feb 07 2017
Bears On S&P500 Can Take Price To 2250Top ↑
January 30 2016
Stocks are moving sharply lower as Trump actions can lead to conflicts between US and some countries. We see market falling back to 2270 very aggressively from 2298 high that was triggered last week, following a completion of a triangle which was a few days earlier. We called that bullish move higher before it happened, but now we should also not be surprised by that turn since we know that trust out of a triangles are final within a higher degree patterns. In other words, we knew that upside is limited as we saw price in wave five, so current reversal lower is start of a deeper corrective set-back. Technically speaking, set-back should be made by minimum three waves lower; an A-B-C structure that can take us back to 2251, then you have 2237 from January 03 gap, and slightly lower is even more important 2228 swing. On the upside keep an eye on wave B which could bounce back to 2288 Sunday, January 29 gap. VOTE HERE Trade well, Grega S&P500 4h chart (1).png)
Set Achievable Goals For 2017 & FlashBack ChartsTop ↑
December 23 2016
This will be my final video of the year. I wish you all all the best in 2017! FLASHBACK CHARTS
E-mini S&P500 At Resistance Ahead Of The FEDTop ↑
December 13 2016
If you are familiar with Elliott Wave patterns then you know that chart below suggests a turning point, at least short-term for a new 3-wave pullback. It's very interesting and exciting to see such structure ahead of the most important FED decision of the year.
GHTrade carefully, with lower leverage, or better not to trade at all, especially if you are up on your account for the year; just don't allow yourself to go down on account in last few weeks of the year. E-mini S&P500 March 2017 contract-1h chart 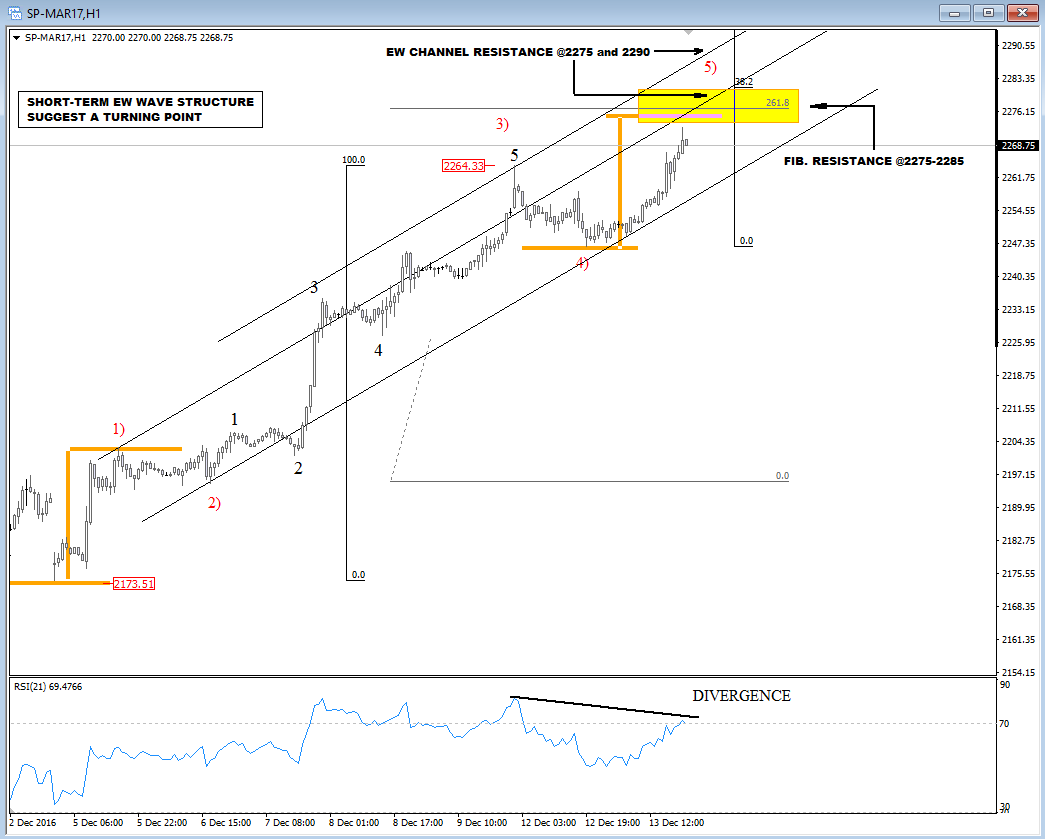 
German Dax Video AnalysisTop ↑
December 06 2016 Hello traders! Below I will walk you through my analysis on German DAX. Actually I will show you my approach to the markets; how I analyze markets and predict next possible leg in combination with trendlines. Have a good day, Grega!
CAD Trade Depends On OilTop ↑
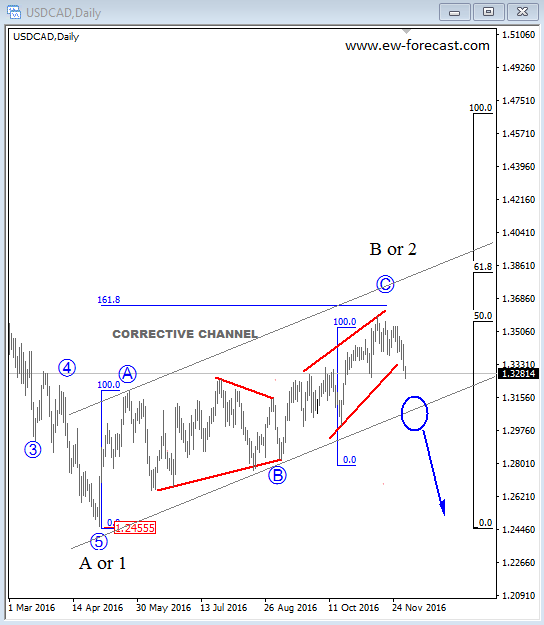
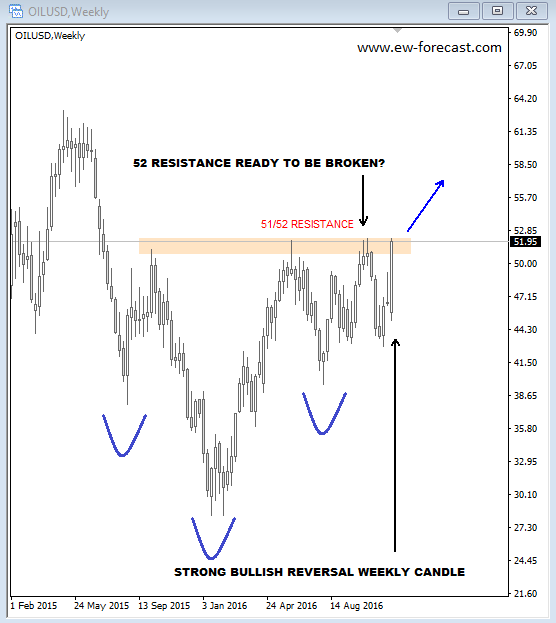
December 04 2016
Hey traders! We have seen a nice move up on oil last week, up more than 15% which was the biggest weekly gain since the 2011 following the OPEC deal to cut crude output. It was a nice move up, now towards $52 per barrel, which looks like an important technical level based on past price moves, but current move has momentum so resistance can be broken which may lift price to much higher levels, ideally towards $60 in weeks ahead. So if you trade oil directly through futures or cfd’s then you may want to keep an eye for short-term buying opportunities on pullbacks. But if you are more of an FX trader, then you will want look for CAD or NOK. Personally I have my eyes on the USDCAD for possible shorts on intraday pullbacks next week, as big recovery from 2016 lows can come to an end. It’s a clear three wave move that signals for a strong bearish reaction in the future. Well, some CAD crosses can be even more interesting if we consider that USD index still hold strong gains in an uptrend. Have a good trading week, Grega
.png) << [1-7][8-14][15-21][22-28][29-35][36-42][43-49][50-56][57-63][64-70][71-77][78-84][85-91][92-98][99-105][106-112][113-119][120-126][127-133][134-140][141-147][148-154][155-161][162-168][169-175][176-182][183-189][190-196][197-203][204-210][211-217][218-224][225-231][232-238][239-245][246-252][253-259][260-266][267-273][274-280][281-287][288-294][295-301][302-308][309-315][316-322][323-329][330-336][337-343][344-350][351-357][358-364][365-371][372-378][379-385][386-392][393-399][400-406][407-413][414-420][421-427][428-434][435-441][442-448][449-455][456-462][463-469][470-476][477-483][484-490][491-497][498-504][505-511][512-518][519-525][526-532][533-539][540-546][547-553][554-560][561-567][568-574][575-581][582-588][589-595][596-602][603-609][610-616][617-623][624-630][631-637][638-644][645-651][652-658][659-665][666-672][673-679][680-686][687-693][694-700][701-707][708-714][715-721][722-728][729-735][736-742][743-749][750-756][757-763][764-770][771-777][778-784][785-791][792-798][799-805][806-812][813-819][820-826][827-833][834-840][841-846] >> |
New York time: 00:00:00
Local time: 00:00:00
| E-mail: | |
HOME
MEMBERS
SERVICE
NEWSLETTER
ELLIOTT SCHOOL
CONTACT
DISCLAIMER
Any reviews, news, analysis, prices or other information contained on our website is provided as general market commentary and delivered electronically through distribution channel to larger number of clients, therefore does not constitute investment advice or investment research. We are not trading advisors. Most of our work is for educational purposes only, with information based on Elliott Wave theory in real time.
Trading forex, futures, options, stocks, cryptocurrenices or any another trading market carries a high level of risk, and may not be suitable for all investors. The possibility exists that you could lose some or all of your initial investment; therefore you should not invest money that you cannot afford to lose. Our website and the information that we provide should not be relied upon as a substitute for extensive independent research before making your investment decisions. In no event will we be liable for any loss or damage on your account in connection with, the use of our products. For any real cash investments you have to contact your financial advisor.
Any information or material contained on our website is owned by Val Global d.o.o.. Reproduction is prohibited without our permission.
Val Global ltd, Dvorjane 7, 2241 Sp. Duplek, Slovenia
| Members area Newsletter |
Services FAQ |
Terms And Conditions Privacy Policy |
||
©2010 - 2020 ew-forecast.com
Design: VOBI