
 |
|
Items 281- out of displayed. << [1-7][8-14][15-21][22-28][29-35][36-42][43-49][50-56][57-63][64-70][71-77][78-84][85-91][92-98][99-105][106-112][113-119][120-126][127-133][134-140][141-147][148-154][155-161][162-168][169-175][176-182][183-189][190-196][197-203][204-210][211-217][218-224][225-231][232-238][239-245][246-252][253-259][260-266][267-273][274-280][281-287][288-294][295-301][302-308][309-315][316-322][323-329][330-336][337-343][344-350][351-357][358-364][365-371][372-378][379-385][386-392][393-399][400-406][407-413][414-420][421-427][428-434][435-441][442-448][449-455][456-462][463-469][470-476][477-483][484-490][491-497][498-504][505-511][512-518][519-525][526-532][533-539][540-546][547-553][554-560][561-567][568-574][575-581][582-588][589-595][596-602][603-609][610-616][617-623][624-630][631-637][638-644][645-651][652-658][659-665][666-672][673-679][680-686][687-693][694-700][701-707][708-714][715-721][722-728][729-735][736-742][743-749][750-756][757-763][764-770][771-777][778-784][785-791][792-798][799-805][806-812][813-819][820-826][827-833][834-840][841-846] >> Bulls In VIew For AUDNZD - Elliott WaveTop ↑  April 04 2019
Hi traders,
AUDNZD can be unfolding a bigger, three-wave recovery with first two legs; A and B already completed. The sharp rally which followed from the 1.0250 area can now be labelled as wave C, that can take price with its five-wave structure towards the 1.0750/1.0800 region in upcoming weeks and months. That said, be aware of temporary retracement that may represent a pause within a wave C rise; first one can follow from the 1.052/1.053 zone. AUDNZD, Daily 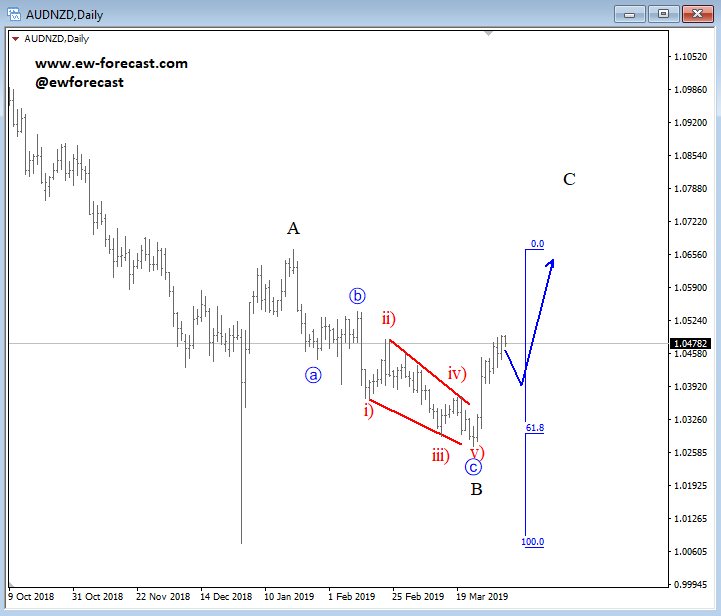
Elliott Waves Suggest a Drop on Gold PricesTop ↑ March 28 2019
Hi traders,
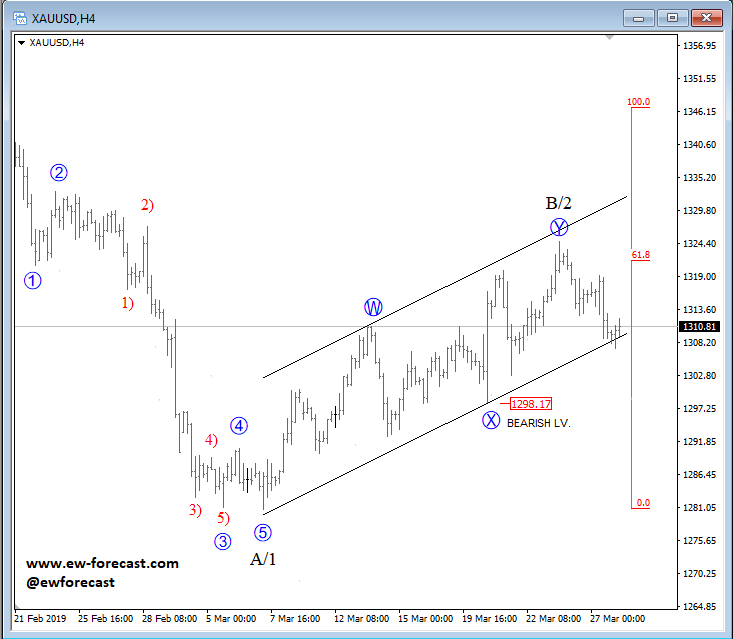
Gold has recovered in March but notice that structure is slow, choppy and overlapping which looks like a correction. Thats either wave B or even wave 2, but in both cases we expect a continuation lower into wave 3 or C that should take price of gold below 1275. In fact, this decline may resume in the next couple of days, especially if current weakness down from recent swing high will cause a decisive break below the corrective channel support line which would be an important evidence for a completed wave B/2. We stay bearish on gold as long as market is below February highs. Trade well, GH
Elliott Waves Suggests Limited Downside For EURUSDTop ↑ March 25 2019
Hello everyone.
This week can be very interesting and important for the EURUSD as pair firstly moved nicely higher last week, but then turned south through Thursday and Monday sessions. Question is fi current bounce will resume, or is downward wedge going to continue? Well, I am tracking two counts from the Elliott Wave perspective, but what is interesting the most between these two is that both suggests limited downside. First one is showing idea of a flat with wave B completed so wave C up may continue. A rise above 1.1450 from here will probably confirm this one. But if from any reason prices breaks to new low of the year, then I am sure there will be again a lot of sellers but likely again on the wrong side as bounce may follow based on our second interpretations which shows idea of an ending diagonal in fifth wave. Which one will be the case? I am not sure at the moment, but what I know is that if pair will starting to see a new recovery above 1.1400 or higher then I would really be interested in long set-ups. Trade well, GH
.png)
Exclusive Elliott Wave Video Update: EURUSD, GBPUSD, AUDUSDTop ↑ March 20 2019
I hope you will enjoy the video. Grega Exclusive Elliott Wave Video Update: EURUSD, GBPUSD, AUDUSD by ew-forecast on TradingView.com
Is USD Headed lower? Elliott Wave VideoTop ↑ March 18 2019
Hello traders,
Finally, I am back from New York traders expo show. Spent some very good time there, learned a lot, met some very good traders and even clients of ours. I also made an episode for USDMXN and Copper at Real Vision TV, so if you have access there make sure to check this out. But I am back know, doing what I love the most; analyzing the market and decided to make this video free to everyone.
Trade well, Grega
Risk-On Suggests More Upside on Oil, while USDMXN Can Face WeaknessTop ↑ March 12 2019
Hi traders, Stocks, specifically S&P500 is turning back to a bullish mode since we have noticed a five-wave rise back to 2800 resistance area. At the same time, even positively correlated market Crude oil remains in a bullish shape, probably within an ending diagonal for wave 5/5), which means that risk-on is still in play. Crude oil, 4h chart 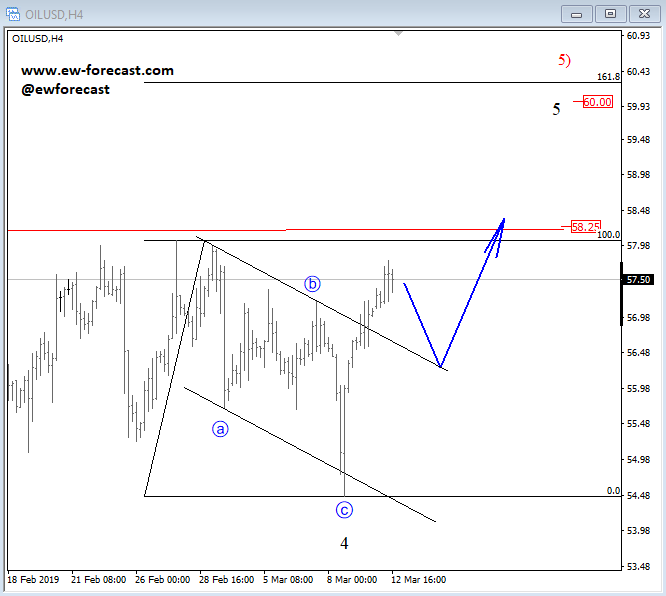 If we consider weak USD and strong Crude oil, then the best opportunity can be on USDMXN pair. And, as you can see USDMXN is falling sharply and just like Crude oil, also for wave 5, so be aware of more weakness towards new lows, while stocks and Crude oil are trading bullish. USDMXN, 4h chart .png)
Risk-off mode Suggests More Weakness on Stocks and On XXX/JPY PairsTop ↑ March 11 2019
the SP500 has turned lower this week, sharply out of the channel in a fifth wave which indicates a completion of an impulse and temporary top at 2800 resistance. We think that a minimum three waves down are in progress now, so more weakness is expected, possibly even back to 2620 after wave B bounce. At the same time this can be the right shoulder in the making. S&P500 chart .png) In risk-off mode JPY is normally the safe haven, so it's not a surprise to see JPY much higher this week, as 10 year US note rises. In fact, 10 year shows a resumption higher into a fifth wave which suggests that there is a chance for more risk-off ahead. There was also a nice breakdown on Nikkei index so money definitely moves into JPY. .png) In such situation we may look at weak XXX/JPY pairs for possible shorts, and based on correlations we see USDJPY and GBPJPY as one of the weakest pairs in current environment. USDJPY, 30Min chart 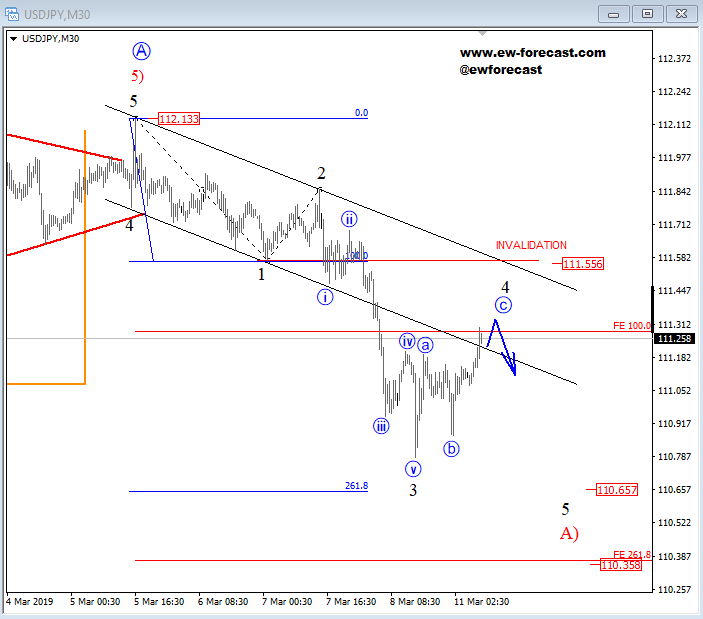 GBPJPY, 1H 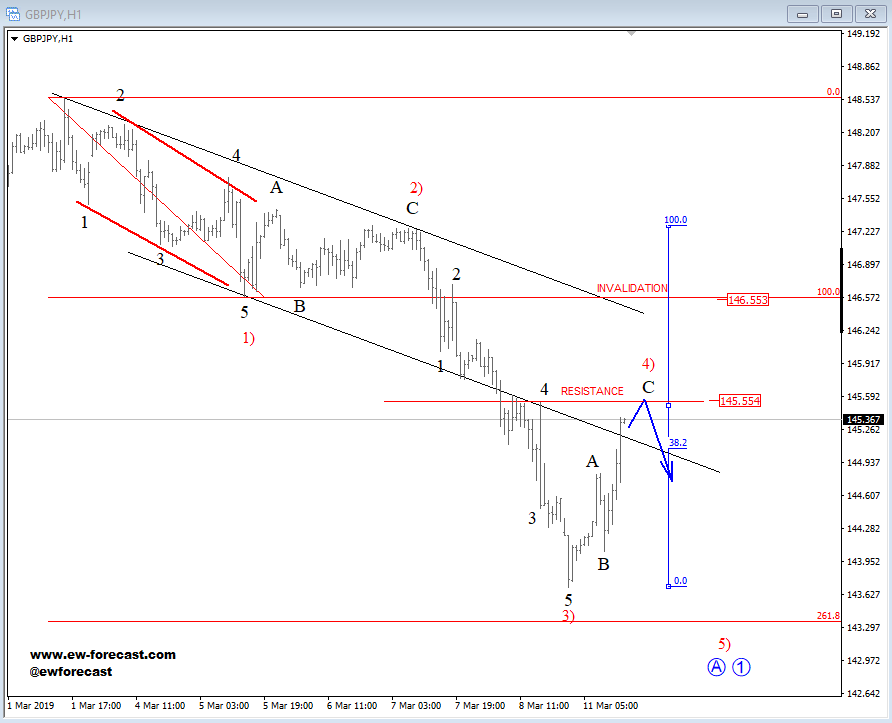 << [1-7][8-14][15-21][22-28][29-35][36-42][43-49][50-56][57-63][64-70][71-77][78-84][85-91][92-98][99-105][106-112][113-119][120-126][127-133][134-140][141-147][148-154][155-161][162-168][169-175][176-182][183-189][190-196][197-203][204-210][211-217][218-224][225-231][232-238][239-245][246-252][253-259][260-266][267-273][274-280][281-287][288-294][295-301][302-308][309-315][316-322][323-329][330-336][337-343][344-350][351-357][358-364][365-371][372-378][379-385][386-392][393-399][400-406][407-413][414-420][421-427][428-434][435-441][442-448][449-455][456-462][463-469][470-476][477-483][484-490][491-497][498-504][505-511][512-518][519-525][526-532][533-539][540-546][547-553][554-560][561-567][568-574][575-581][582-588][589-595][596-602][603-609][610-616][617-623][624-630][631-637][638-644][645-651][652-658][659-665][666-672][673-679][680-686][687-693][694-700][701-707][708-714][715-721][722-728][729-735][736-742][743-749][750-756][757-763][764-770][771-777][778-784][785-791][792-798][799-805][806-812][813-819][820-826][827-833][834-840][841-846] >> |
New York time: 00:00:00
Local time: 00:00:00
| E-mail: | |
HOME
MEMBERS
SERVICE
NEWSLETTER
ELLIOTT SCHOOL
CONTACT
DISCLAIMER
Any reviews, news, analysis, prices or other information contained on our website is provided as general market commentary and delivered electronically through distribution channel to larger number of clients, therefore does not constitute investment advice or investment research. We are not trading advisors. Most of our work is for educational purposes only, with information based on Elliott Wave theory in real time.
Trading forex, futures, options, stocks, cryptocurrenices or any another trading market carries a high level of risk, and may not be suitable for all investors. The possibility exists that you could lose some or all of your initial investment; therefore you should not invest money that you cannot afford to lose. Our website and the information that we provide should not be relied upon as a substitute for extensive independent research before making your investment decisions. In no event will we be liable for any loss or damage on your account in connection with, the use of our products. For any real cash investments you have to contact your financial advisor.
Any information or material contained on our website is owned by Val Global d.o.o.. Reproduction is prohibited without our permission.
Val Global ltd, Dvorjane 7, 2241 Sp. Duplek, Slovenia
| Members area Newsletter |
Services FAQ |
Terms And Conditions Privacy Policy |
||
©2010 - 2020 ew-forecast.com
Design: VOBI