
 |
||||
E-Mini S&P500Top ↑ 
May 11 2017
We may see a deeper pullback on stocks, based on E-mini S&P500 count which shows a three wave move from March lows into a new all time high that was seen just for a day near 2400. Price is ticking lower now, so we may see a retracement back into the middle of a 2319-2400 trading range to make this wave four more complex; a flat maybe even a triangle. Also, there is a gap near 2350 that may not stay open for a long time. Once wave four correction will show evidences of a completion a new strong bullish run may show up.
Why to fight that trend from 2009 low, when each retracement proved to be corrective since then. Why would this time be any different? It's not enough data to look for a top yet. 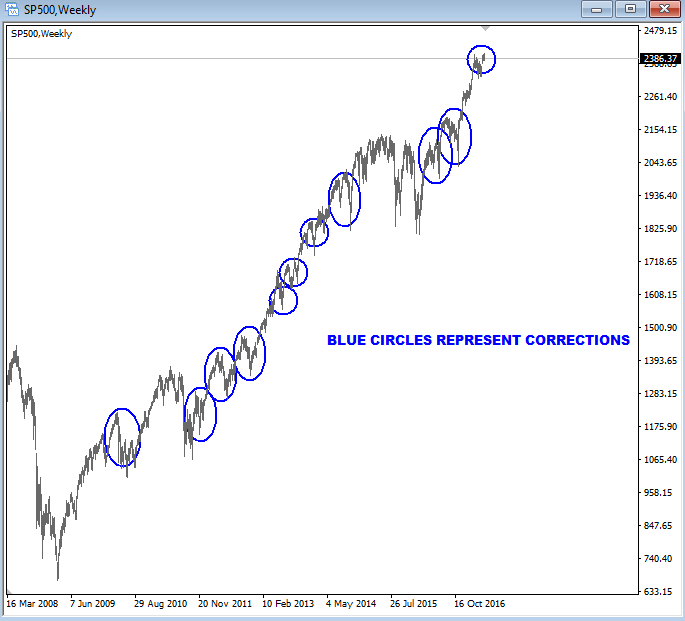 Newsletter archive
|
New York time: 00:00:00
Local time: 00:00:00
| E-mail: | |
HOME
MEMBERS
SERVICE
NEWSLETTER
ELLIOTT SCHOOL
CONTACT
.png)
.jpg)
DISCLAIMER
Any reviews, news, analysis, prices or other information contained on our website is provided as general market commentary and delivered electronically through distribution channel to larger number of clients, therefore does not constitute investment advice or investment research. We are not trading advisors. Most of our work is for educational purposes only, with information based on Elliott Wave theory in real time.
Trading forex, futures, options, stocks, cryptocurrenices or any another trading market carries a high level of risk, and may not be suitable for all investors. The possibility exists that you could lose some or all of your initial investment; therefore you should not invest money that you cannot afford to lose. Our website and the information that we provide should not be relied upon as a substitute for extensive independent research before making your investment decisions. In no event will we be liable for any loss or damage on your account in connection with, the use of our products. For any real cash investments you have to contact your financial advisor.
Any information or material contained on our website is owned by Val Global d.o.o.. Reproduction is prohibited without our permission.
Val Global ltd, Dvorjane 7, 2241 Sp. Duplek, Slovenia
| Members area Newsletter |
Services FAQ |
Terms And Conditions Privacy Policy |
||
©2010 - 2020 ew-forecast.com
Design: VOBI