
|
Next Aug 10 2011 Gold Looking Bullish Gold eyeing Fibo levels around 1800, while above 1720! .gif) Previous Next Aug 11 2011, 03:15EDT Gold Update Gold moved above $1800 per ounce! .gif) Previous Next Aug 29 2011, 03:15EDT Eur/Chf Before and After Nice clean break higher on Eur/Chf after we recognized a triangle, which is a continuation pattern. Here is what we noted at that time, just before price exploded higher:
  Previous Next Sep 01 2011, 03:05EDT Risk Off To Come!? If not today then maybe tomorrow after the NFP!?  Previous Next Sep 02 2011, 07:24EDT, Euro-monitoring two wave Counts .gif) Previous Next Sep 05 2011, 07:23EDT German DAX Update German DAX at new lows. Click here for previous update on DAX  Join us now and get more timely and accurate analysis today! Previous Next Sep 08 2011, Eur/Usd At A"Critical Juncture" .gif) Previous Next Sep 09 2011, Cable At New Lows Expanded flat on cable Chart below was posted for members on Sep 08 2011, when downtrend was expected to continue, after we notied that wave B9 formed a shape of an expanded flat. So far, cable fell to 1.5890. Click here for a basic structure of an expanded flat in a bull market! (2).gif) Join us and get timely and accurate analysis today! Previous Next Sep 16 2011, 08:05EDT Euro: Back to basics! Euro is forming higher highs and higher lows, and as long this is the case, trend is up. Notice that "swing lows" are still in place, last one at 1.37. Only break of that level will suggest that top is in and that market is headed lower. And why we think that pair is headed lower!? Well, because recovery from the lows is just awful and clearly corrective! .gif) Previous Next Sep 21 2011, Usd/Chf Update Usd/Chf is trading very close to 0.9 psychological level, that we mentioned in one of our past article, published here. Current development suggest that pair still may reach levels around 0.91, 261.8% Fiboancci exntesion target.  Join us now and get more timely and accurate analysis today! Previous Next Sep 21 2011; Eur/Usd Eur/usd reversed nicely lower today from 1.3790 gap area, after the FOMC Statement. Here is a chart that was shared with our subsrber, hours before the FOMC statemment, with an importnat note:
Join us and get timely and accurate analysis today! .gif) Previous Next Sep 21 2011; Gold and S&P Correlation Gold and stocks are trading in tandem!  Previous Next Oct 04 2011; SP Fut vs. Euro .gif) Previous Next Oct 07 2011, S&P Futures At Resistance .gif) Previous Next Oct 11 2011, Eur/Usd (Weekly) Running triangle Pair is showing some evidence of a support around 1.3140 region, but only temporary as we believe that pair is moving higher into a final stages of a running triangle.  Previous Next Oct 17 2011; Euro: Impulsive Advance Wave five in progress, watch out for reversals in this week. Resistance at 1.393-1.4. .gif) Previous Next Oct 18 2011; Gold Headed Lower Gold is falling sharply today, and based on the wave structure, prices are headed towards the levels from September. The reason is price action from previous lows; clearly corrective, identified by a slow, choppy and overlapping price action.  Previous Next Oct 19 2011; SP500 Wave Counts S&P500 facing resistance at 1220/30 from Aug 31 and Sep 16. Join us now and get more timely and accurate analysis today! .gif) Previous Next Oct 22 2011; TLT-iShares Barclays 20+ Year Treasury Bond Fund TLT trades lower since prices completed a five wave, impulsive advance from the lows. As such, current bearish reversal is considered as a corrective; three wave (A)-(B)-(C) pattern that will try to find the support in 107-111 region! *When stocks are up, yields are up, TLT is down and dollar is down;and vice-versa! *iShares Barclays 20+ Year Treasury Bond Fund (the Fund) seeks investment results that correspond generally to the price and yield performance of the Barclays Capital U.S. 20+ Year Treasury Bond Index (the Index). The Index measures the performance of public obligations of the United States Treasury that have a remaining maturity of 20 or more years.  Join us now and get more timely and accurate analysis today! Previous Next Nov 01 2011; TLT-iShares Barclays 20+ Year Treasury Bond Fund; Updated Count Gap filled after (A)-(B)-(C) move lower. Further gains now expected!  Previous Next Nov 02 2011; DAX Ready For A Fall!? -Corrective personality from the lows -Prices reversed from around 61.8%. -Decline from above 6400 appears impulsive -Break off 5740 swing low and through corrective channel will provide new larger bearish leg for the market.  Previous Next Nov 15 2011; 10year U.S. Notes 10year US notes futures (expires 21 of Dec 2011) is showing a bullish technical set-up, through 131 resistance, which is positive for the US dollar.  Previous Next Nov 17 2011; Italy's problems Italy has carried a heavy debt for many years. So why is it stumbling now? Marketplace senior editor Paddy Hirsch explains in the video below! The root of Italy's problems from Marketplace on Vimeo. Previous Next Nov 18 2011; S&P500 Intra-day Bearish bias while below 1243! If you like our analysis, and if you would like to join our services, register here and get our services for just 45€ per month. .gif) Previous Next Nov 23 2011; TLT Updated Count TLT moved nicely higher since our past update , which in fact was the main reason for Dollar Bullish scenario at that time. Click for article here Since then Dollar index bounced nicely higher from 77 to current levels above 79! Join us now and get more timely and accurate analysis today!  *When stocks are up, yields are up, TLT is down and dollar is down;and vice-versa! *iShares Barclays 20+ Year Treasury Bond Fund (the Fund) seeks investment results that correspond generally to the price and yield performance of the Barclays Capital U.S. 20+ Year Treasury Bond Index (the Index). The Index measures the performance of public obligations of the United States Treasury that have a remaining maturity of 20 or more years. Previous Next Nov 30 2011; Gold; Bearish Set-up "If we get an impulsive fall into 1690 area, then you know where gold prices will go" If you like our analysis, and if you would like to join our services, register here and get our services for just 45€ per month.  Previous Next Dec 06 2011; More upside for Eur/Chf  If you like our analysis, and if you would like to join our services, register here and get our services for just 45€ per month. Previous Next Dec 12 2011; S&P Futures intra-day Prices eyeing levels around 1210/15. Meanwhile dollar should strengthen. .gif) If you like our analysis, and if you would like to join our services, register here and get our services for just 45€ per month. Previous Next Dec 15 2011; Aud/Usd Similarity Two very equal patterns on the 4h chart bellow! Can Aud/Usd breaks higher!? If you like our analysis, and if you would like to join our services, register here and get our services for just 45€ per month. .gif) Previous Next Dec 21 2011; Gbp/Usd Intra-day Nice run higher on cable, which is now approaching some Fibonacci resistance levels for wave (3). If you like our analysis, and if you would like to join our services, register here and get our services for just 45€ per month. .gif) Previous Dec 29 2011; Gold Intra-day Nice fall on gold, but there is still room for further weakness, towards 1530-September lows. Click here for our past update.  Previous Next Dec 21 2011; Oil-From Intra-day Updates Below is example of oil chart that was shared with our subscribers today, posted at 04:35EST
 If you like our analysis, and if you would like to join our services, register here and get our services for just 45€ per month. Previous Next Jan 11 2012; Gbp/Aud Triangle Nice, real-time but very rare example of a fourth wave triangle where wave E) is also a triangle! .gif) Previous Next Jan 26 2012; Eur/Aud Ready To Extend Lower .gif) Previous Next Jan 31 2012; Crude Oil .gif) Previous Next Jan 31 2012; Usd/Inr Incomplete Impulse We expect a pull-back into 50 area in wave 4 retracement, before we will look for a downtrend continuation. Divergence also suggests that temporary low could be forming. If you like our analysis, and if you would like to join our services, register here and get our services for just 45€ per month. .gif) Previous Next Feb 07 2012; More Downside For Eur/Gbp We are monitoring Eur/Gbp very closely for potential short opportunity with members. To join our services register here .gif) Previous Next Feb 10 2012; 10 year US bonds vs. S&P Futures To join our services register here .gif) Previous Next Feb 16 2012; 10 year US bonds Updated chart To join our services register here .gif) Previous Next Feb 21 2012; Silver Targeting $36 Silver is breaking higher, now moving into a wave five, targeting $35.60-$36. Click here and see the chart from Feb 16 2012 that we shared with our members.  Previous Next Feb 22 2012; Gold Trade Example Below its an example of a trade set-up that we took with members. And here is the update count: Gold Update (1).gif) Previous Next Feb 24 2012; Oil At Resistance Watch out for a top and corrective reversal! .gif) Previous Next Feb 27 2012; Silver Update #2 Silver reached perfectly our 35.60 projected target, but uptrend in fifth wave advance is still incomplete. We expect further rise, now up to $37 for black wave v of (iii). For past forecast on Silver click here  Previous Next Mar 01 2012; How The Perfect Wave Four Looks Like!? All is on the chart below... oh, and also check the 1h lower, it was a text book double zig-zag example in wave 4) which was done and confirmed after an impulsive rise. .gif) 1h .gif) Previous Next Mar 14 2012; S&P Futures Intra-day: 1400 Break In View .gif) Previous Next Mar 19 2012; TLT Headed Down To 103-106 Region TLT is trading lower for the past few days, after breaking out of traingle consolidation placed in wave (B) position. As such, current fall must be wave (C) headed into Fibo supports at 103-106 area. This chart suggests more upside for US yields which means more upside for Stocks as well! .gif) *iShares Barclays 20+ Year Treasury Bond Fund (the Fund) seeks investment results that correspond generally to the price and yield performance of the Barclays Capital U.S. 20+ Year Treasury Bond Index (the Index). The Index measures the performance of public obligations of the United States Treasury that have a remaining maturity of 20 or more years. Previous Next Mar 26 2012; Correlations-Copper, Gold and Aud  Previous Next Apr 04 2012; Eur/Usd Intra-day .gif) Previous Next Apr 10 2012; Eur/Usd Head and Shoulders .gif) Previous Next Apr 11 2012; World Markets Looking Bearish  Previous Next Apr 13 2012; S&P Futures And Euro Bears S&P Futures should fall below 1352. If current correlation with Eur/Usd remains in play then this means another 140pips down for the pair.  Previous Next Apr 24 2012; S&P Futures Euro is now trading very close to its weekly highs, as the US stocks reversed from the previous lows ! We are now tracking two counts on S&P but both are corrective. Triangle, or flat!? More sideways on stocks in the near-term means unidirectional movements for the FX. .gif) Previous Next May 04 2012; Gold Now Eyeing $1600 Wave B) triangle appears complete. Red trend-line break will send price to 1600, potentially 1580. Wave count from a week back  Previous Next May 10 2012; Dollar Index .gif) Previous Next May 29 2012; Inter-market Analysis .gif) Previous Next June 01 2012; Eur/Usd Intra-day Bottoming...? But for how long? .gif) Previous Next June 01 2012; Inter-Market Analysis FX moves suggest that market will reverse into a temporary recovery... .gif) Previous Next June 05 2012; Aud/Usd Aussie trades now around 0.9800 after RBA cut. It was a nice trade plan for members. Updated count .gif) Previous Next June 12 2012; S&P Futures "Correction" .gif) Previous Next June 15 2012; GBPUSD Two Intra-day Counts Sideways price action is always tricky; Monitoring two counts on cable; 1.5470 and 1.5560 are key levels, but sooner or later pair should extend above 1.56. .gif) Previous Next June 22 2012; EURUSD Weekly Downtrend Continuation .gif) Previous Next July 03 2012; EURAUD Intra-day Corrective pull-backs should be interesting for shorts.  Previous Next July 16 2012; EURUSD: Correction Within Downtrend .gif) Previous Next July 17 2012; S&P500; Key Level @1325 S&P500 cash is still sideways or even bullish. Bearish only after a daily close price below 1325. .gif) Previous Next July 19 2012; AUDUSD Impulsive Rally We just closed AUDUSD long for 110pip gain. We will now observing wave four pull-back for re-entries. .gif) Previous Next July 20 2012; EURUSD Intra-day Looking For Weakness towards 1.2100/1.2120 .gif) Previous Next July 30 2012; EURAUD intra-day Looks like EURAUD is falling within wave three on the intra-day basis. Trader who are interested to get involved in current downtrend will wait on fourth wave pull-backs.  Previous Next Aug 03 2012; TLT Signals For More Upside On Stocks We suspect that today and in next week TLT will move sharply to the downside, from current wave B) levels. We know that ETF TLT is correlated with US Bonds Futures, which means that if price on chart below fall then US yileds will rise. Well, higher US yileds means higher stock prices, whcih may send the USD lower against EUR, AUD and others, if correlations remain in normal shape. Can NFP be a trigger for such scenario and TLT weakness to 125.50-126.00 area during the US hours!? .gif) Previous Next Aug 03 2012; AUDUSD: Reverse Triangle .gif) Previous Next Aug 16 2012; EURUSD Now Eyeing 1.2440 (1).gif) Previous Next Aug 20 2012; S&P500 Inta-day Bullish price action remains in play on stocks for one more push up, based on S&P500 cash market, which wants to test April 1422 high it seems. We expect a break of this level before market turns bearish. Does it have something to do with psychology you think!? .gif) Previous Next Aug 31 2012; Crude Oil Intra-day Crude oil is breaking higher after clearly three down from AUG 23 high. However, I still want to see a daily/weekly close price above that falling trend-line to make sure that this market is headed higher. Grega .gif) Previous Next Sep 04 2012; EURUSD 4h count  Previous Next Sep 06 2012; Dollar Index Now Eyeing 80.50 Sideways price action signals for more weakness.  Previous Next Sep 11 2012, AUDUSD Intra-day AUD is acting very strong today compared to others. In-fact AUDUSD is showing qualities of an impulsive rally, so pull-backs should be on the radar. If AUDUSD will be able to extend above 1.0400 then our focus will be wave four pull-back for Longs in five. .gif) .gif) Previous Next Sep 17 2012; NASDAQ 100 .gif) Previous Next Sep 19 2012; EURUSD Correction EURUSD is trading lower, forming a deeper corrective pull-back as pair trying to break below a rising trend-line that may send pair down to 1.2930. .gif) Previous Next Sep 20 2012; EURUSD Update (video) Talking about a confirming price action and current situation on EURUSD. Free 7-day Trial Previous Next Sep 28 2012; Spanish Yields Two Head and Shoulders patterns and one Head. Price now at the neckline resistance of the larger pattern. Free 7-day Trial  Previous Next Oct 04 2012; Cable Intra-day Decline on GBPUSD appears to be a text-book example of a double zig-zag pattern. .gif) Previous Next Oct 05 2012; EURUSD Intra-day We are tracking two counts on the EURUSD. Free 7-day Trial .gif) Previous Next Oct 09 2012; EURUSD Intra-day .gif) Previous Next Oct 26 2012; EURUSD: Sideways .gif) Previous Next Oct 30 2012; EURUSD Triangle Update EURUSD is sideways, but bullish on the intra-day basis within wave D) up to 1.3040-1.3100. .gif) Previous Next Nov 01 2012; EURUSD; 1.2900 "Do or Die" .gif) Previous Next Nov 06 2012; EURUSD Intra-day .gif) Previous Next Nov 12 2012; AUDUSD Bullish Structure Three waves of a pull-back and five wave rise through channel resistance line; thats bullish. I will keep an eye on it for longs. Grega .gif) Previous Next Nov 27 2012; EURUSD At 1.3000 Pair could reverse lower in the next few sessions, into a corrective wave four from 1.3000-1.3020 resistance.  Take advantage of our special offer “2 Months for Price of 1” and check our latest forecast today. Register here Previous Next Nov 30 2012; Silver Is Bullish Silver is trading sideways, which appears to be a nice fourth wave triangle pattern which is a continuation pattern, so break higher is expected.  Previous Next Dec 07 2012; NASDAQ 100 .gif) Previous Next Dec 14 2012; NZDUSD NZDUSD is now trading slightly below wave three trading channel so we suspect that deeper pull-back is finally here. Ideally thats wave four-circled headed to 0.8350 support. .gif) Previous Next Dec 14 2012; EURUSD Daily .gif) Nov 13 2012 Free Video Analysis Previous Next Jan 02 2013; USD Goobye Kiss  Test our services now absolutely free: "7-day trial" Click here Previous Next Jan 14 2013; EURUSD .gif) Previous Next Jan 16 2013; DAX Futures .gif) Previous Next Jan 17 2013; USDJPY Hits 90 .gif) Previous Next Jan 18 2013 USD Index .gif) Previous Next Jan 23 2013; Euro Bund .gif) Previous Next Jan 25 2013; Euro Bund Update .gif) Previous Next Feb 01 2013: EURUSD Five wave Cylce This was a text-book example of a five wave rally that caused a turning point. .gif) Previous Next Feb 04 2013; EURUSD .gif) Previous Next Feb 06 2013; DAX Futures .gif) Previous Next Feb 07 2013; S&P500 .gif) Previous Next Feb 11 2013; DAX Futures Five waves down and only three waves up is nice and clear bearish Elliott Wave cycle for DAX Futures. .gif) Previous Next Feb 12 2013; EURAUD Final stages of a fourth wave triangle before break higher? .gif) Click here for 7-day trial offer Previous Next Feb 15 2013; Natural Gas: "How Clear Pattern Works" Previous Next Feb 26 2013; GOLD Intra-day A three wave bounce on gold suggests weaker gold prices in sessions ahead. Break of lower support line and 1583 swing could be trigger for weakness down to 1550.  Previous Next Feb 28 2013; GOLD vs. S&P  Previous Next Mar 01 2013; EURUSD "Before and After" .gif) Previous Next Mar 05 2013; S&P Reversal Head and Shoulder Pattern .gif) Previous Next Mar 07 2013; EURJPY Back To Bullish Mode EURJPY is looking bullish for fifth wave. .gif) Previous Next Mar 12 2013; AUDUSD Below it's updated AUDUSD from that article : click here .gif) Previous Next Mar 13 2013; DAX DAX appears to be in fourth wave; uptrend is expected to resume. .gif) Previous Next Mar 13 2013; EURUSD Daily Line chart Sometimes it's better to keep an eye on line chart because of clearer price action. .gif) Previous Next Mar 18 2013; EURUSD Intra-day .gif) Click here for 2 for 1 Special offer Previous Next Mar 20 2013; GBPUSD 4h Count  Previous Next Apr 04, 2013; Ending Diagonal On EURUSD?  Previous Next Apr 07 2013; EURUSD - Corrective Rally Pair could retrace back to 1.3100-1.3200 within corrective rally. .gif) Previous Next Apr 08 2013; USDJPY Intra-day .gif) Previous Next Apr 12 2013; GOLD Intra-day Bearish Swings .gif) Previous Next Apr 17 2013; S&P Head & Shoulders Bearish Pattern .gif) 7 Day Free Trial is available to NEW Members Previous Next Apr 22 2013; GBPUSD Corrective Rally  7 Day Free Trial is available to NEW Members Previous Next Apr 23 2013; OIL Could Fall to $84 Broken channel from late 2012 low suggests lower prices and possible re-test of 83/84 level. .gif) 7 Day Free Trial is available to NEW Members Previous Next Apr 29 2013; USDJPY Decreasing momentum on USDJPY could mean that bulls are coming to an end!  7 Day Free Trial is available to NEW Members Previous Next Apr 30 2013; S&P500 Daily S&P500 is at new highs and now eyeing 1620 level where price will test a trend-line connected from 2000 highs.  7 Day Free Trial is available to NEW Members Previous Next May 01 2013; US Stocks Futures Elliott Wave patterns suggests more weakness on US Stocks Futures in the near-term. .gif) 7 Day Free Trial is available to NEW Members Previous Next May 02 2013; AUDUSD "Down-trend Continuation"  7 Day Free Trial is available to NEW Members Previous Next May 03 2013; GOLD-Recovery Is Incomplete  7 Day Free Trial is available to NEW Members Previous Next May 03 2013; EURJPY Trying To Break Higher .gif) 7 Day Free Trial is available to NEW Members Previous Next May 06 2013; USDCAD Approaching 2012 Trendline  7 Day Free Trial is available to NEW Members Previous Next May 06 2013; AUDUSD Clear Pattern Elliott Wave Clear Pattern Set-up Formula: Three wave rally + impulsive sell-off + channel break + pull-back reversal from resistance line = Downtrend Continuation .gif) 7 Day Free Trial is available to NEW Members Previous Next May 08 2013; USD Index: Bullish Reversal!?  7 Day Free Trial is available to NEW Members Previous Next May 14 2013; USD Index Update  7 Day Free Trial is available to NEW Members Previous Next May 16 2013; GOLD: Downtrend Continuation Pattern  7 Day Free Trial is available to NEW Members Previous Next May 17 2013; GBPUSD Bearish Breakout  7 Day Free Trial is available to NEW Members Previous Next May 22 2013; EURJPY .gif) 7 Day Free Trial is available to NEW Members Our Set-up count: Long at market after completed wave 4, Stop at 130.90 and Target 133.80 for wave 5.  Previous Next May 29 2013; EURUSD: Triangle Pattern Triangles are continuation pattern, so we could see 1.2700 if lower side of a range gives way. .gif) 7 Day Free Trial is available to NEW Members Previous Next May 31 2013; S&P Futures-Bearish Set-up  7 Day Free Trial is available to NEW Members Previous Next Jun 03 2013; S&P Futures Follow Up S&P moved nicely lower since our latest Free Chart. Intra-day bearish price action is now in progress. Tracking two wave counts now: S&P Futures count #1-wave three of fives waves down .gif) S&P Futures count #2-wave c of a corrective pull-back .gif) 7 Day Free Trial is available to NEW Members Previous Next Jun 6 2013; S&P Futures Follow Up II. S&P Futures count #1- wave b triangle, now wave c down .gif) S&P Futures count #2- wave three in progress of a larger bearish impulsive decline .gif) Previous Next Jun 06 2013; FTSE 100 Thats very bearish wave count, which could send this market much deeper if 16155 gives way.  7 Day Free Trial is available to NEW Members Previous Next Jun 11 2013; Commodity Index .gif) 7 Day Free Trial is available to NEW Members Previous Next Jun 18 2013; Crude Oil Is Looking Bullish .gif) 7 Day Free Trial is available to NEW Members Previous Next June 20 2013; EURUSD Intra-day .gif) 7 Day Free Trial is available to NEW Members Previous Next June 21 2013; EURUSD Intra-day Update .gif) Previous Next Jun 25 2013; USDJPY Temporary Recovery  Previous Next Jun 26 2013; EURUSD Thats probably the most important technical chart for the EURUSD at the moment. Its pointing lower! Click here for our Free Video on EURUSD, recorded on June 24th 2013.  Previous Next Jul 05 2013; USDCAD Intra-day .gif) Previous Next Aug 05 2013; Crude Oil Oil prices are at interesting support zone. .png) Click here and get more analysis Free for 7 days Previous Next Aug 06 2013; S&P Futures .png) Click here and get more analysis Free for 7 days Previous Next Aug 08 2013; EURUSD EURUSD is up but divergence and slow price action suggest a reversal in coming days. 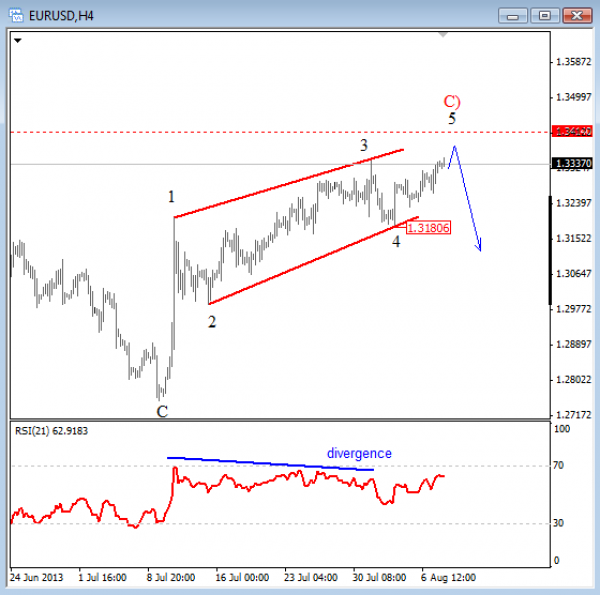 Click here and get more analysis Free for 7 days Previous Next Aug 18 2013; USDJPY .png) Click here and get more analysis Free for 7 days Previous Next Aug 21 2013; GBPUSD .png) Click here and get more analysis Free for 7 days Previous Next Aug 27 2013; DJIA DJIA is looking bearish for fifth wave of decline.  Click here and get more analysis Free for 7 days Previous Next Aug 30 2013; USD Index-Inverse H&S Pattern Based on inverse H&S pattern on USD Index chart, we may see rise to 83.00 next week. Bullish view remains valid as long as 81.00 is not breached. .png) Click here and get more analysis Free for 7 days Previous Next Sep 04 2013; USDJPY Another consolidation within current uptrend suggests higher levels in the very near-term. 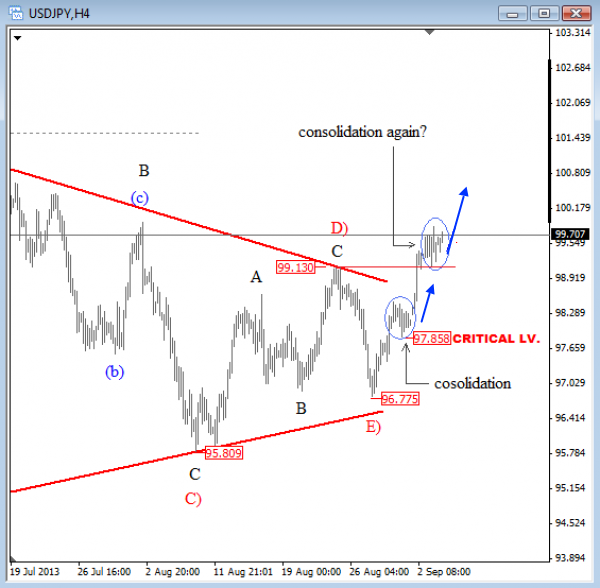 Click here and get more analysis Free for 7 days Previous Next Sep 09 2013; GBPUSD GBPUSD is in bullish mode but the wave structure suggests that resistance is near. 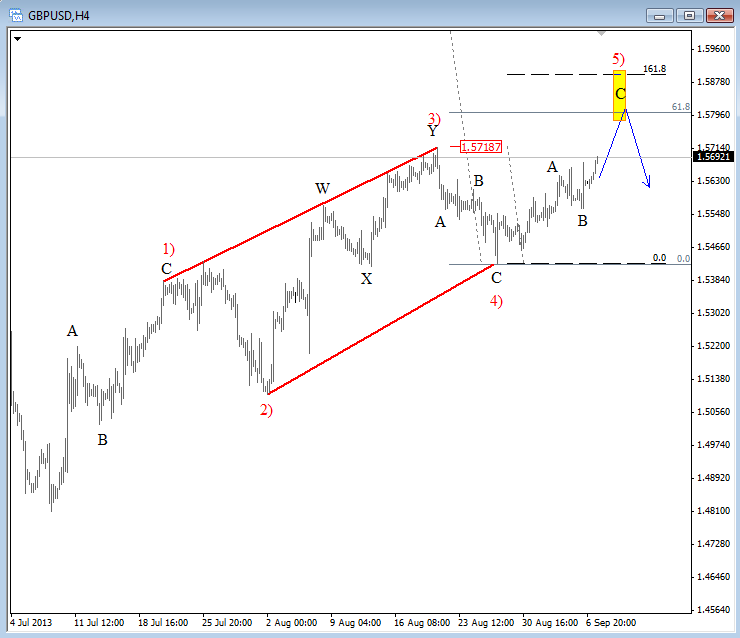 Click here and get more analysis Free for 7 days Previous Next Sep 11 2013; Crude Oil  Click here and get more analysis Free for 7 days Previous Next Sep 13 2013; Crude Oil Short-term Sharp bearish reversal through the corrective channel line is pointing for lower prices. .png) Click here and get more analysis Free for 7 days Previous Next Sep 16 2013; GOLD .png) Click here and get more analysis Free for 7 days Previous Next Sep 19 2013; USD Index Weekly Reversal  Click here and get more analysis Free for 7 days Previous Next Sep 20 2013; USDJPY Intraday Intraday structure is pointing towards 99.90/100.  Click here and get more analysis Free for 7 days Previous Next Sep 25 2013; USD Index Intraday Pull-back on USD Index is looking corrective! Be aware of lower USD, particularly against EUR, GBP and CHF .png) Click here and get more analysis Free for 7 days Previous Next Oct 01 2013; German DAX Corrective wave four appears complete. Click here for past article on German DAX Click here and get more analysis Free for 7 days .png) Previous Next Oct 03 2013; Crude Oil Intra-day Click here and get more analysis Free for 7 days .png) Previous Next Oct 08 2013; Crude Oil Update II. Click here and get more analysis Free for 7 days .png) Previous Next Oct 14 2013; E-Mini S&P 500 Nice five wave rally suggests more upside on S&P after a corrective retracement. .png) Click here and get more analysis Free for 7 days *no credit card required Previous Next Oct 15 2013; German DAX Update Below it's an updated price chart which shows a fifth wave in progress after we highlighted a corrective retracement into wave 4 reversal zone. Sep 26th Article: click here .png) Click here and get more analysis Free for 7 days *no credit card required Previous Next Oct 17 2013; GOLD .png) Click here and get more analysis Free for 7 days *no credit card required Previous Next Oct 29 2013; EURUSD Intra-day Downside on EURUSD could be limited. Click here and get more analysis Free for 7 days *no credit card required .png) Previous Next Nov 01 2013; GOLD Head And Shoulders!? .png)  Previous Next Nov 04 2013; EURUSD .png)
Previous Next Nov 11 2013; EURUSD We are focused on two upside resistance levels for this week 1.3470 and 1.3540. Don't miss out our Special offer 2 For 1 expires in few hours. Click here .png)
Previous Next Nov 14 2013; EURUSD-Price Is King Nice example why technicals work the best. ECB rate cut losses covered on a tick, now down again!?   Previous Next Nov 18 2013; EURUSD Video  Previous Next Nov 20 2013; EURUSD Daily Trendline ...when broken support becomes resistance .png) Previous Next Nov 25 2013; GOLD H&S Update Neckline broken; projected levels at 1200/1210 followed by 1130. 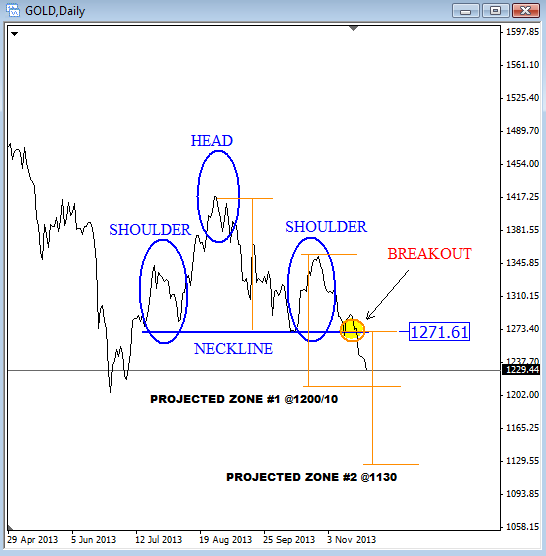 Previous Next Dec 05 2013; EURUSD Respects 61.8% 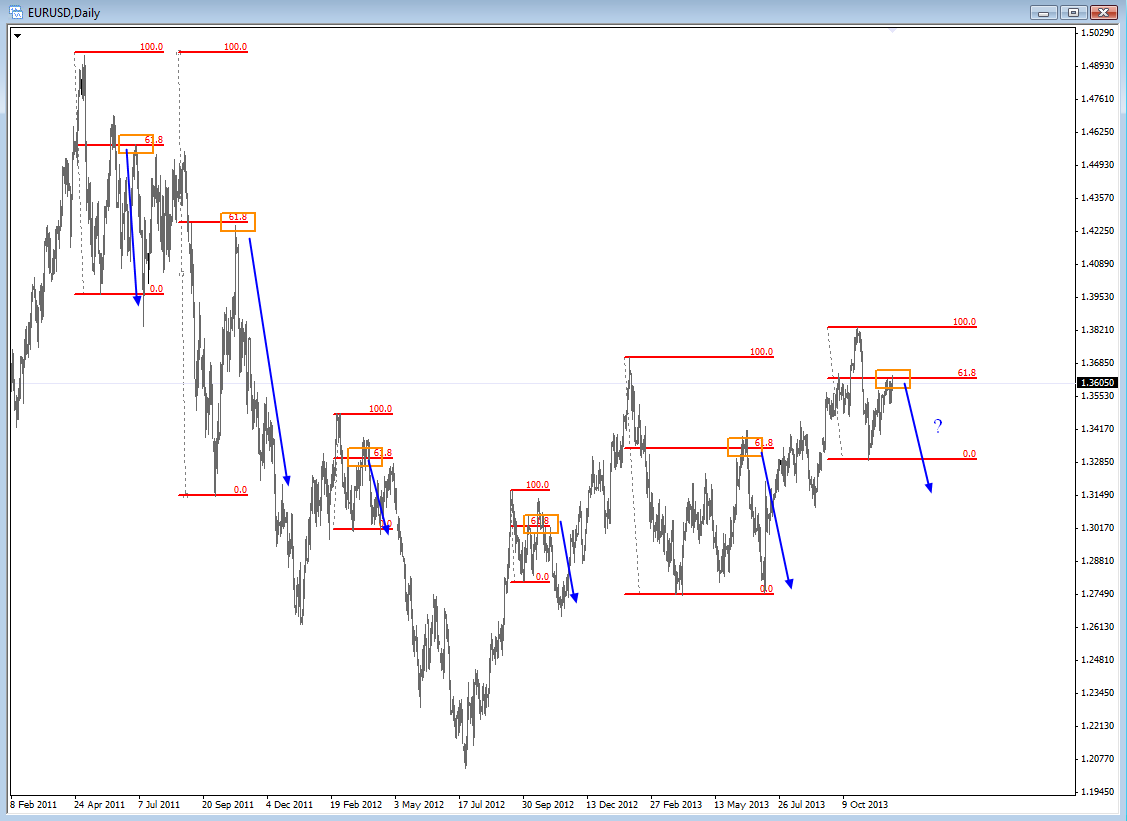 Previous Next Dec 09 2013; German DAX Keeping a close eye on 9220-9300 resistance area. .png) Previous Next Dec 19 2013; German DAX Update II. .png) 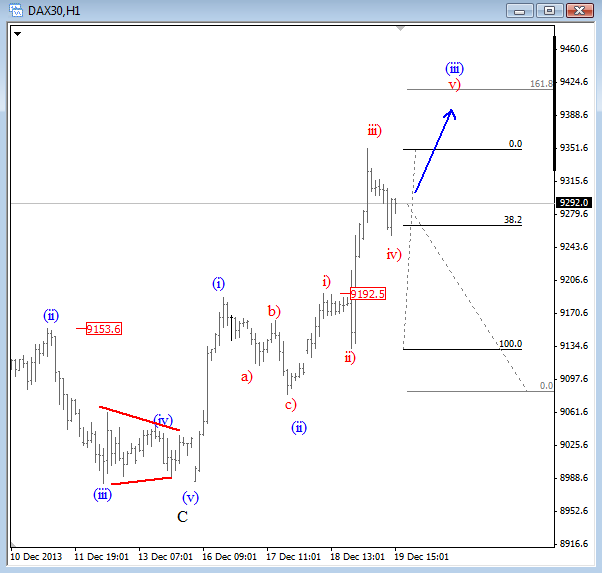 Previous Next Dec 20 2013; German DAX Update III. 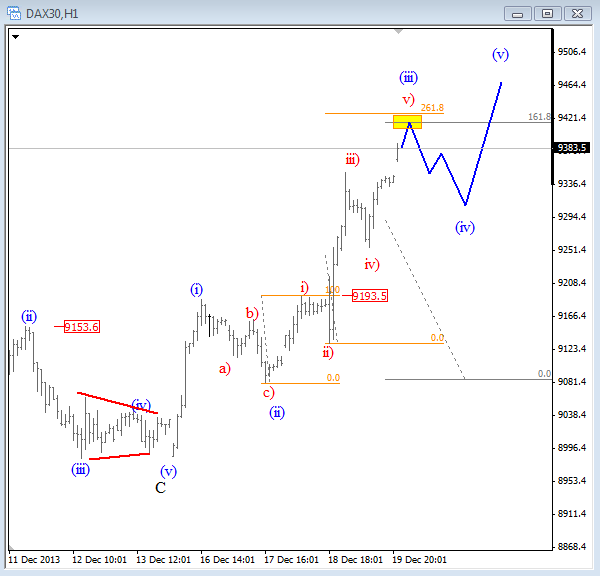 Previous Next Dec 24 2013; Video Analysis Below you will find a video that was recorded and released for members on Dec 17 2013. We covered EURUSD, GOLD, OIL and the S&P. If you want access to similar videos on time and take advantage of the market moves before they happen, then make sure to check our services and subscribe for 14-day TRIAL for just 1€. We wish you all the best in 2014! Previous Next Jan 02 2014; Ending Diagonal On GBPUSD  Previous Next Jan 03 2014; GBPUSD Update II Five waves down and three up is a bearish wave structure that is pointing down on GBPUSD. .png) (3).jpg) Previous Next Jan 06 2014: S&P Futures Looks like price is heading down in three legs. Intraday resistance comes in at 1830/1835. .png)  Previous Next Jan 14 2014; S&P Futures Update S&P is now testing swing highs from December. Will broken resistance become a support? Keep an eye on 1826 for continuation back to the highs. .png) Previous Next Jan 15 2014; Natural Gas Turning Bullish .png) Previous Next Jan 17 2014; USDJPY Video Previous Next Jan 24 2014; Natural Gas Update II. Nice move up on natural gas following the Elliott Wave cycles. Click here for our past update 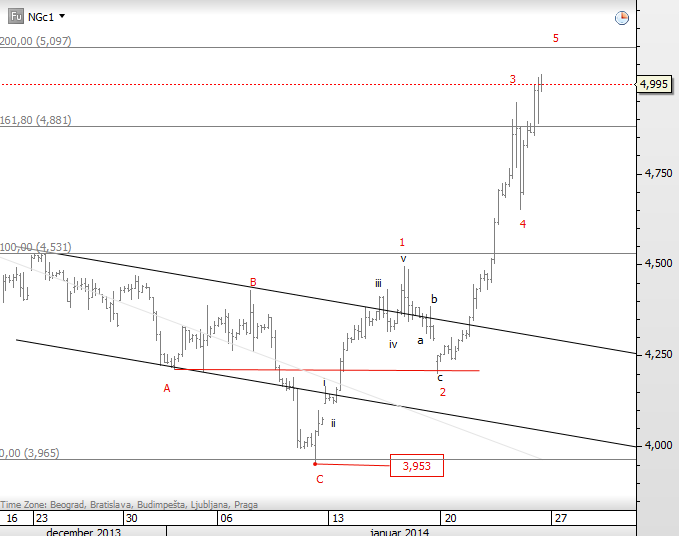 Previous Next Jan 28 2014; S&P Futures .png) Previous Next Feb 11 2014; Now and Then: Crude Oil
Previous Next Feb 18 2014; GOLD Gold is trying to turn down from wave (c)=(a) equality level. Impulsive decline will put price back in bearish mode. 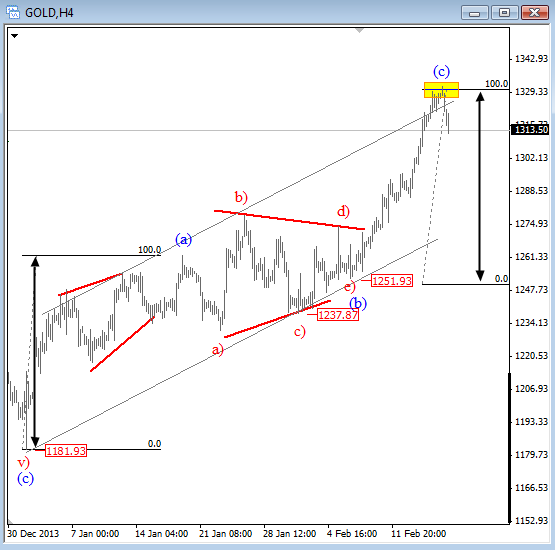 Previous Next Feb 21 2014: GBPUSD A Corrective Set-back Bigger uptrend could resume soon. 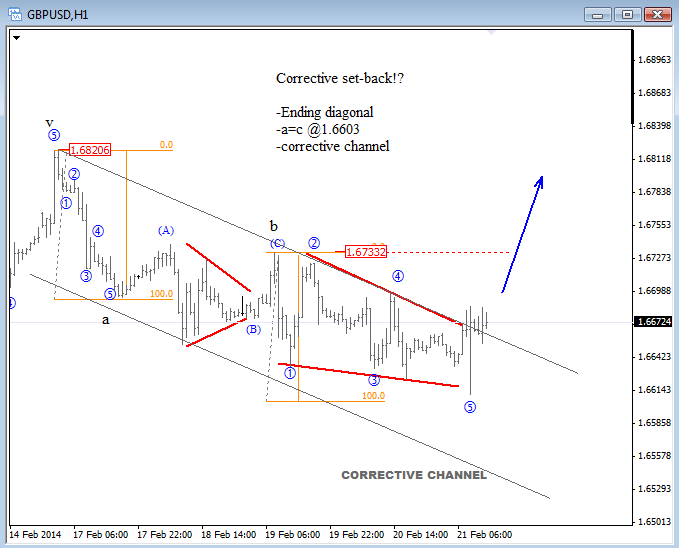 Previous Next Mar 05 2014; EURAUD Head & Shoulders Pattern Is Pointing Higher 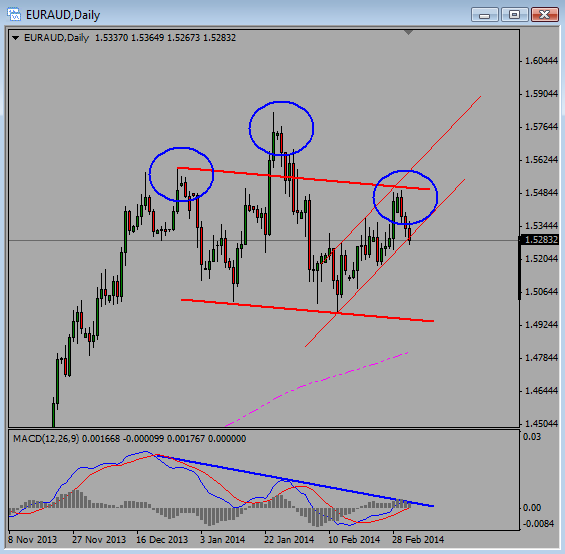 Previous Next Mar 06 2014; S&P Up, Gold And Oil Down Market divergence; Can lower commodities limit S&P gains!? .png) Previous Next Mar 12 2014; GBPUSD Intraday Five waves down suggests a reversal in price. I am keeping an eye on potential five wave rally from the lows that would allow me to consider Longs. To check full details of our technical view on GBPUSD then you may want to check the latest article and webinar: Article Webinar Grega .png)  Previous Next Mar 12 2014 US Yields vs S&P500 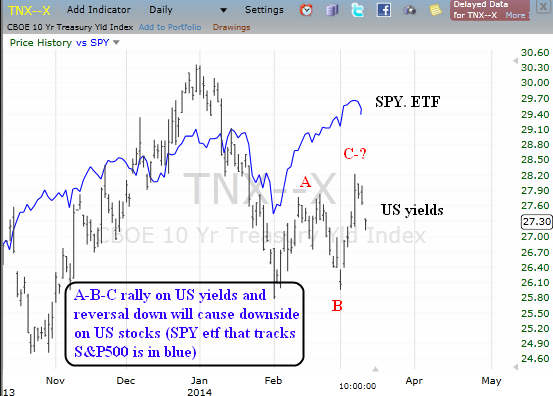 Previous Next Mar 18 2014 Copper Decline on copper is looking impulsive, so we suspect that market will remain bearish. Resistance for fourth wave comes in around 3.0300-3.0600.  .jpg) Previous Next Mar 27 2014 S&P500 S&P Futures sold-off from 1865 resistance two days in the row when the US market opened. Today it may happen similar but from 1850/1855. ___ Join me on our free Elliott Wave Live analysis on Monday Mar 31 2014 at 12:00GMT. I will cover some major markets and highlight interesting patterns. Register here Trade well, Grega .png)  Previous Next Apr 09 2014; Market Correlations .png) Previous Next Apr 30 2014; Video Analysis: Silver Previous Next May 06 2014; USD Index- Breakdown In View 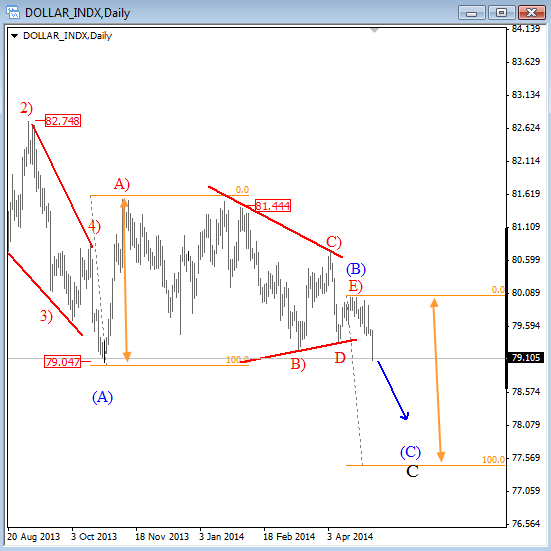 Previous Next May 14 2014; German Dax  Previous Next May 28 2014; GOLD Triangle Broken Levels on the downside; 1255 and 1231. .png) Previous Next May 30 2014; GOLD vs GBPUSD Interesting positive correlation between GBP and GOLD. Coincidence or shall we rely on it more often? .png) Previous Next June 16 2014; GOLD vs GBP Update II Gold and GBPUSD were trading into the same direction within downtrend in May , and positive correlation is also now within uptrend. Looking for more upside on both. 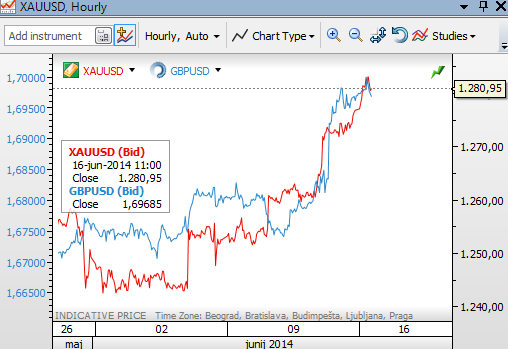 Previous Next July 23 2014; DAX vs S&P S&P is at the highs while the DAX is lagging. Can Germany catch the US!? .png) Previous Next July 30 2014; EURUSD At 1.3400 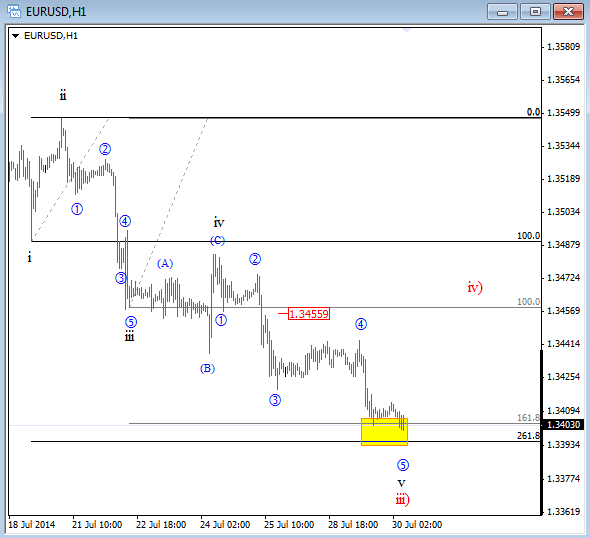 Previous Next EXCLUSIVE OFFER AVAILABLE NOW: 2 Months For Price Of 1 Aug 22 2014; S&P500: It Was Just A Correction S&P500 4h | August 08, 2014 "We were looking for only temporary corrective decline, and reversal back to the highs"  S&P500 4h | August 22, 2014 "Two weeks later the S&P reaches a new all-time high. What next!? If you are familiar with the EWP then you will know it that upside can be limited..."  Previous Next EXCLUSIVE OFFER AVAILABLE NOW: 2 Months For Price Of 1 Sep 04 2014; AUDJPY AUDJPY at important levels based on the weekly count with a 5 down 3 up. Reversal may follow in weeks ahead especially if S&P will stay limited around 2K. 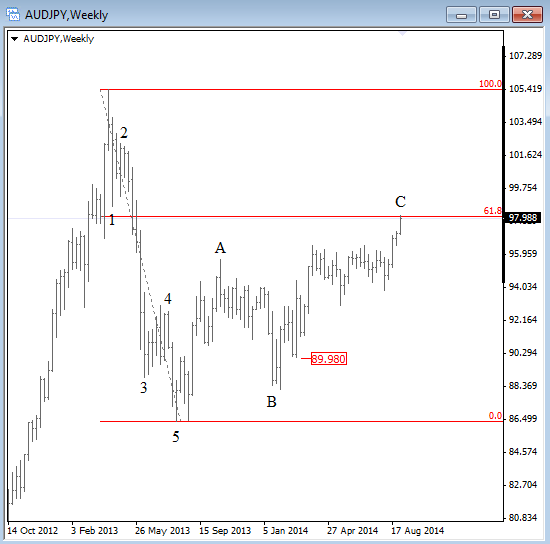 Previous Next Sep 12 2014; USDCAD "Flashback Chart" Trade process:
Previous Next Sep 15 2014; SMI - Swiss Market Index EXCLUSIVE OFFER AVAILABLE NOW: 2 Months For Price Of 1 .png) Previous Next Sep 24 2014; GBPUSD Remains Bearish GBPUSD could continue sharply lower once channel gives way EXCLUSIVE OFFER AVAILABLE NOW: 2 Months For Price Of 1 (1).png) Previous Next Oct 02 2014; Crude Oil Path #Clear pattern on Crude oil puts price in bearish mode Catch market swings. Try our services now! EXCLUSIVE OFFER AVAILABLE: 2 Months For Price Of 1
Previous Next Oct 09 2014; USD Index "Do or Die" Support USD Index has turned down in this week, and now testing an important equality level on intraday charts that comes in at daily trendline connected from mid August. Keep in mind that bigger trend is still up! Catch market swings. Try our services now! EXCLUSIVE OFFER AVAILABLE: 2 Months For Price Of 1 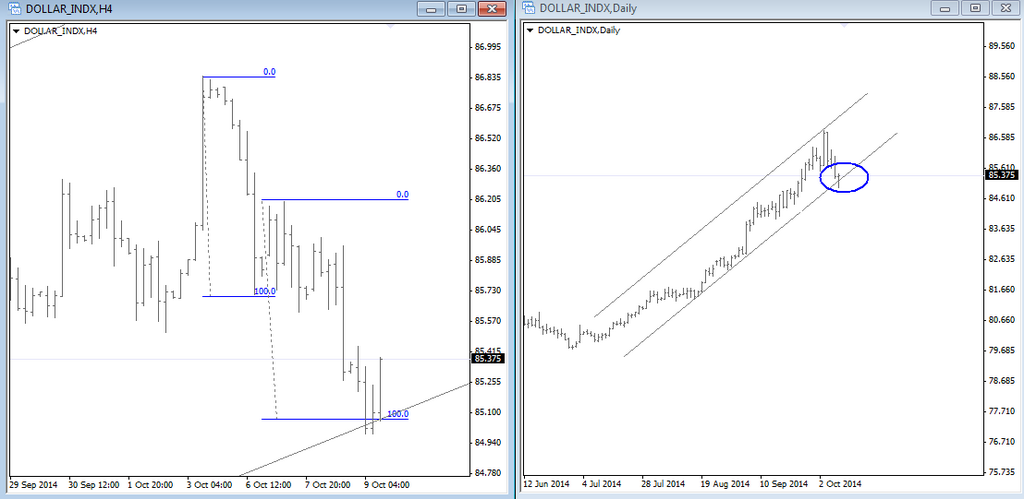 Previous Next Oct 10 2014; DAX Testing Neckline I do not like call a top or bottom in any market so we need to be patient and wait on a weekly maybe even monthly close beneath the neckline before downtrend continuation can be confirmed. For now, price still only testing a trendline. Catch market swings. Try our services now! EXCLUSIVE OFFER AVAILABLE: 2 Months For Price Of 1 .png) Previous Next Nov 05 2014; E-mini S&P Futures Nice clear pattern on 15min time frame. we see five waves up, so be away of a set-back before looking for more gains. This trend stay up as long as 1995 remains in place. I would not be buying it here. Catch market swings. Try our services now! EXCLUSIVE OFFER AVAILABLE: 2 Months For Price Of 1
We shared strategy for long USDJPY when price was at 108 and still holding. Same with gold on bearish side from 1233 .png) Previous Next Nov 17 2014; Copper Weekly View I got a couple of emails regarding my long-term view on copper, after I shared long-term view on Silver on Friday (Click here for Video Analysis on Silver). Well, copper is bearish, but price action to the downside is not so aggressive, actually momentum is decreasing so I would not be surprised if market turns bullish in 2015. Previous Next Dec 01 2014; E-mini S&P500 "Fve waves from the highs/lows are always interesting; it tells you that trend can be changing, even if just temporary." Grega .png) Previous Next Jan 02 2015; USDJPY vs S&P500 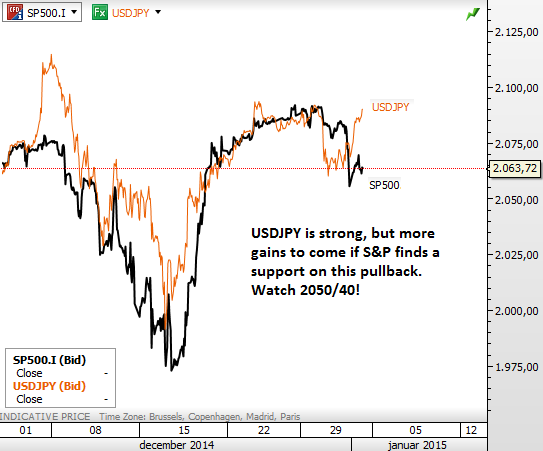 A Special Holiday Offer on Yearly Membership with 31% OFF!!
+ CHRISTMAS GIFT; Mt4 Elliott Wave Scripts For Easy Manual Labeling (VALUE: 100€) (CLICK HERE) We have Limited Time on this offer so if you are interested make sure to take advantage of discount. Offer expires on Jan 11 2015.  31% OFF!! Previous Next Feb 26 2015; GBPUSD Intraday Video Intraday video analysis for GBPUSD- Reversal in play!? Previous Next Mar 06 2015; GBPUSD Bearish Impulse .png) Previous Next Mar 27 2015; EURUSD 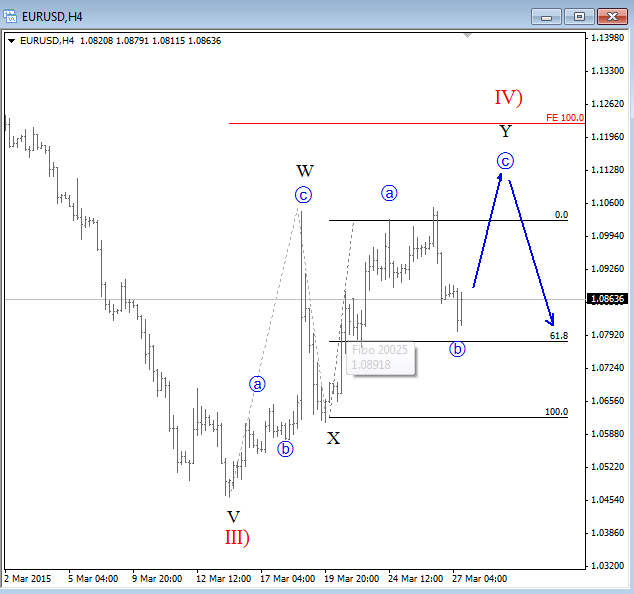 Previous Next Mar 31 2015; AUDJPY -Bears In Action It's good to keep an eye on bearish waves when important trendline like this on AUDJPY turns into a resistance. Interested in our analysis? Limited Offer "First 2 Months For Price of 1" is available to new and returing customers. .png) Previous Next Apr 21 2015; NASDAQ100 Looking Nice Three legs down, and strong impuslive reactions up. So where do you think NASDAQ100 is headed? Join our Free Webinar on Wednesday April 22nd at 12.00GMT. REGISTER HERE .png) Previous Next Apr 28 2015; EURAUD Downward Correction EURAUD is slowly approaching to a support with an (A)-(B)-(C) retracement. Interested in our analysis? Limited Offer "First 2 Months For Price of 1" is available to new and returing customers. 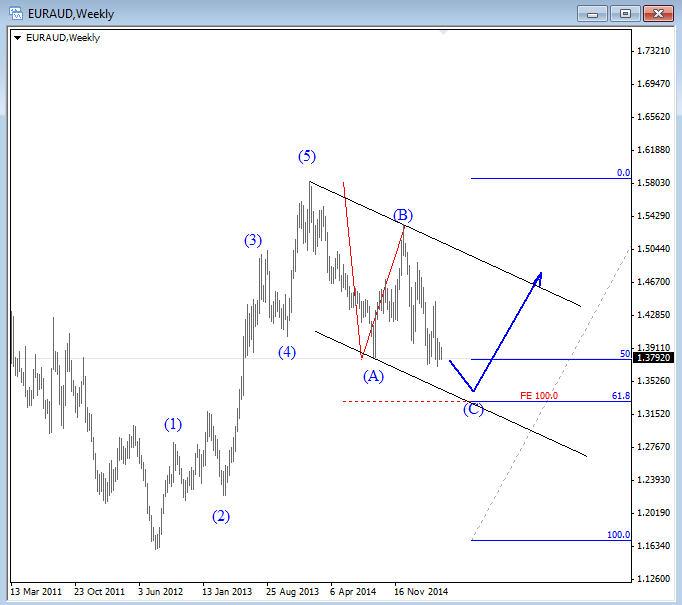 Previous Next May 03 2015; USDJPY Continuation Patterns Clear continuation pattern on USDJPY weekly chart. No reason to fight the trend. We are looking higher. Register Today and Try our service for 1 Month For Only 1€!! 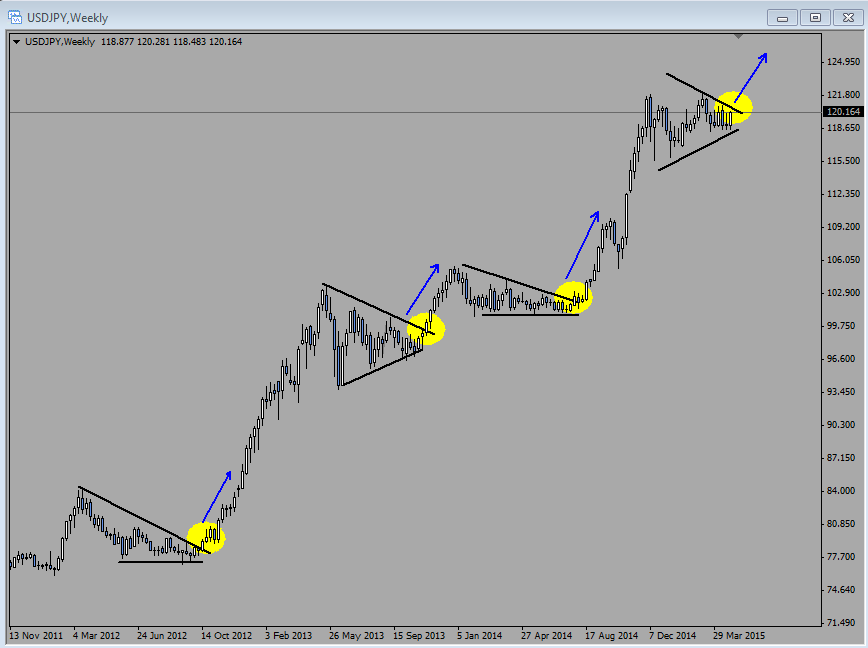 Previous Next May 08 2015; EURGBP Weakness EURGBP could go to lower levels after a short-term bounce towards 0.7350/0.7400 resistance. Register Today and Try our service for 1 Month For Only 1€!! .png) Previous Next May 11 2015; DAX It could be too soon to turn bearish on German Dax as price bounced from the Oct 2014 trendline, which means that trend is still up. Register Today and Try our service for 1 Month For Only 1€!!  Previous Next May 13 2015; Bullish 10 Year US Yields We see a reversal Head and Shoulders pattern on 10 year US yields, probably already completed, so price may reach higher levels in weeks ahead. Looking up to 2.5, maybe even 2.8. Register Today and Try our service for 1 Month For Only 1€!! .png) Previous Next June 11 2015; Apple Remains Bullish A triangle, continuation pattern can be finished on Apple. Highs can be retested in days by the end of June. Register Today and Try our service for 1 Month For Only 1€!! 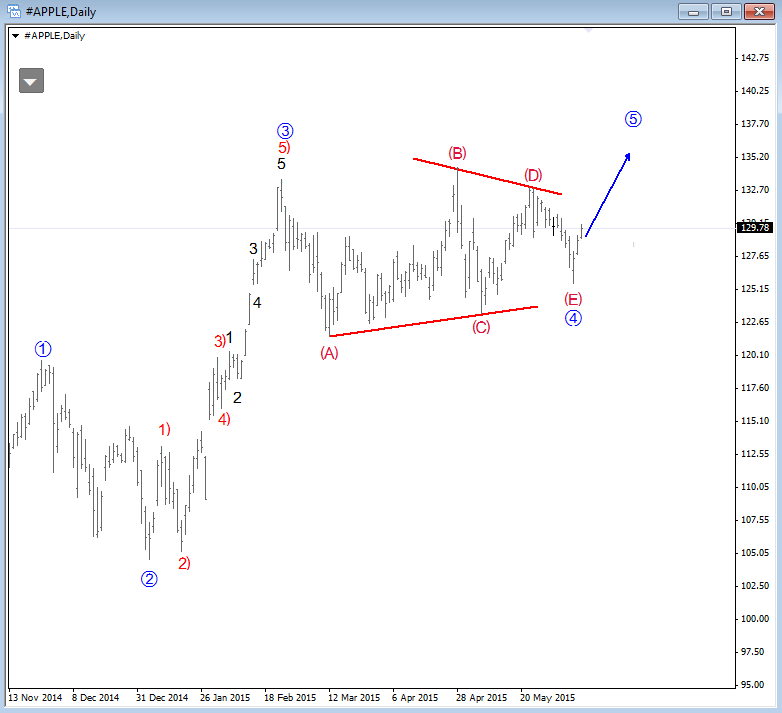 Previous Next June 16 2105; USDNOK Could Rally Through 8.0000 Five waves up in May suggests more upside in days ahead. Break above 7.8880 could cause a strong upward reaction. Register Today and Try our service for 1 Month For Only 1€!! .png) Previous Next June 23 2015; German Bunds Looking Bullish Five waves up followed by a three wave pullback is bullish pattern from an Elliott Wave perspective. At the same time we see potential H&S pattern, now near completion. Ideally market will turn higher for a third wave rally back to 152.50 in days ahead. What bullish Bunds mean for other markets? Try our service and get your answer today for 1 Month For Only 1€!! .png) Previous Next June 23 2015; Intraday Video In the video below we covered EURUSD, AUDUSD and GOLD. Try our service today for 1 Month For Only 1€!! Previous Next June 30 2015; CHFJPY Can Be Turning South Weekly, CHFJPY  Daily, CHFJPY 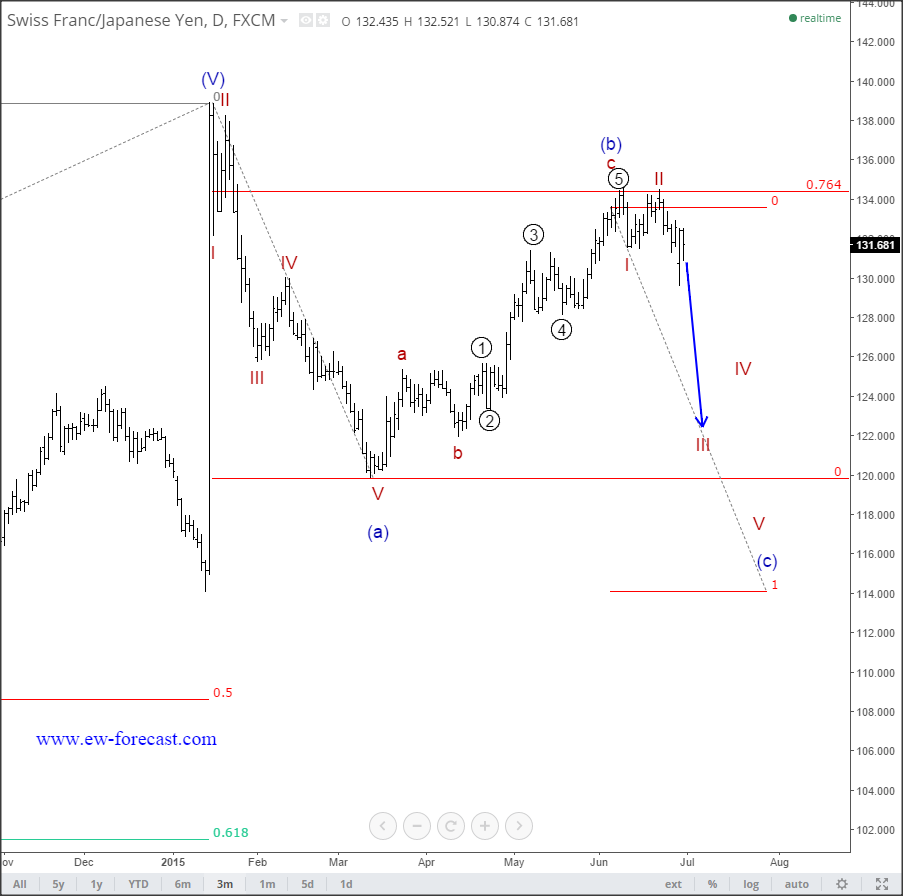 Try our service today for 1 Month For Only 1€!! Previous Next July 03 2015, Cotton Could Move Higher In Days Ahead As wee see correction in blue wave B seems to be finished, as price moved sharply to the upside. That said new leg up in blue wave C is expected to unfold in weeks ahead. The price may move towards 72 - 73 area. Try our service today for 1 Month For Only 1€!! Cotton, Daily 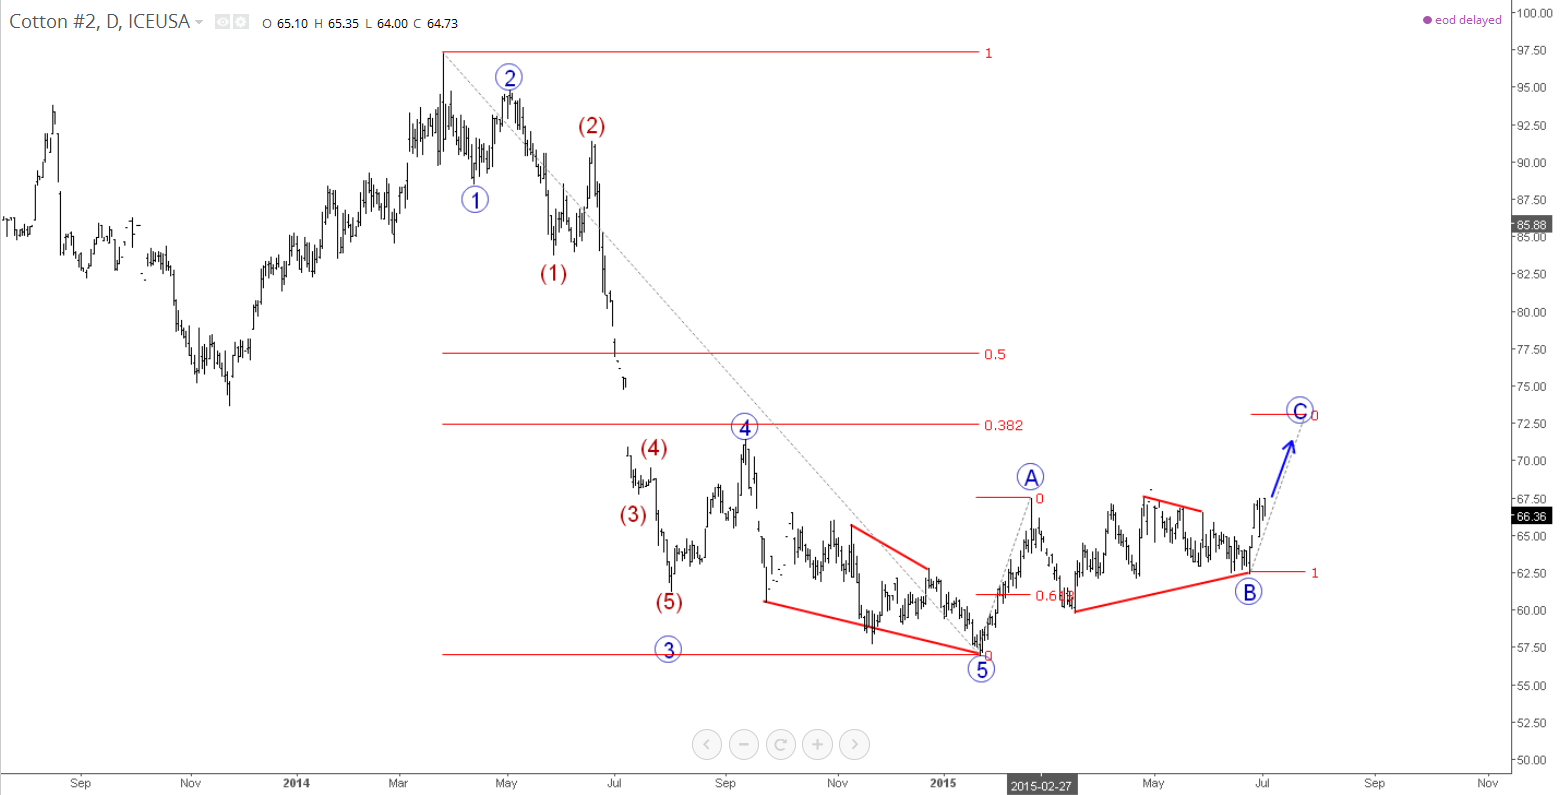 Previous Next July 13 2015; Intraday View On GBPJPY GBPJPY is turning bullish. Try our service today for 1 Month For Only 1€!! GBPJPY, 2h 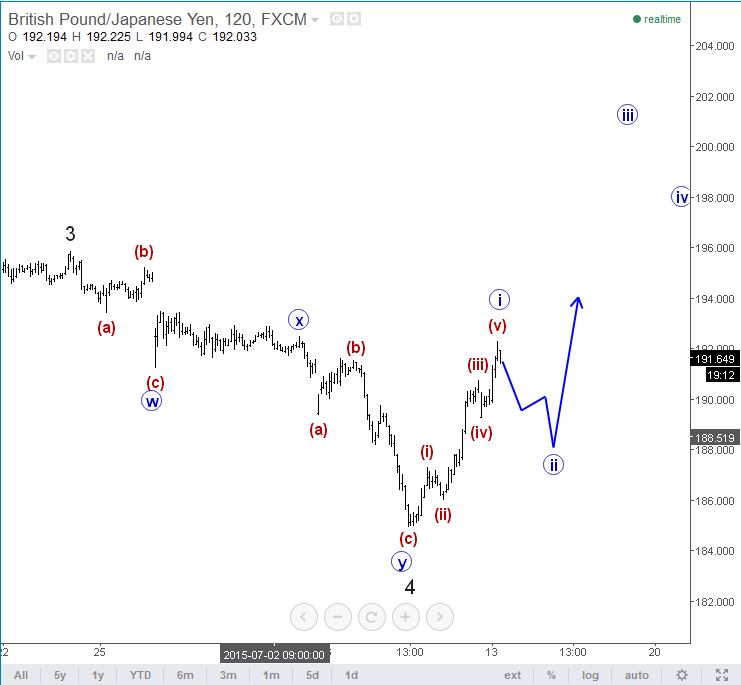 Previous Next July 15 2015; NZDUSD Could Move Lower In Days Ahead On the Daily chart of NZDUSD price made three waves down with black wave (iii) still unfolding. That said pair is now trading in a correction in blue wave iv. After the correction is completed, price may continue to lower levels. Try our service today for 1 Month For Only 1€!! NZDUSD, Daily 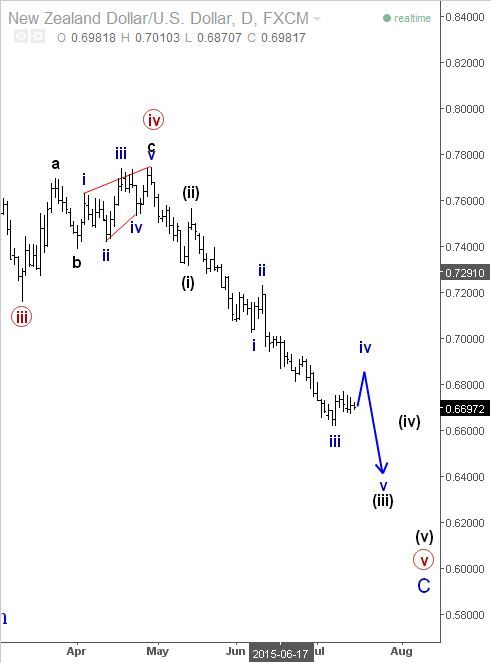 NZDUSD, 2H 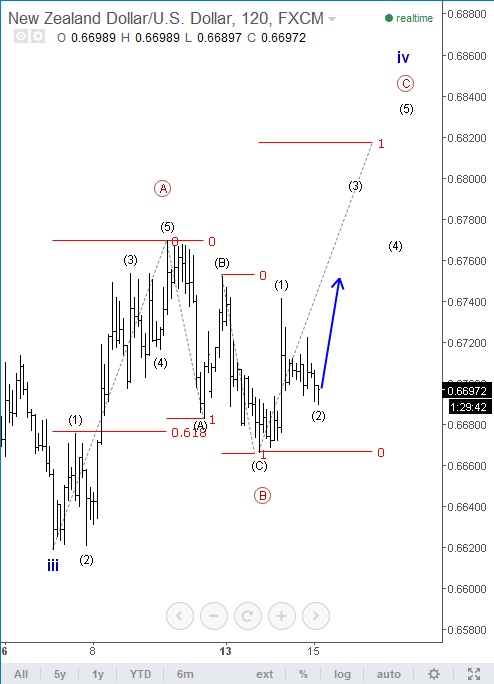 Previous Next Aug 05 2015; USDCHF Showing Quality Of An Impulse USDCHF can be nice for longs in one of upcoming fourth waves while market trades above 0.9703 invalidation figure. Try our service today for 1 Month For Only 1€!! 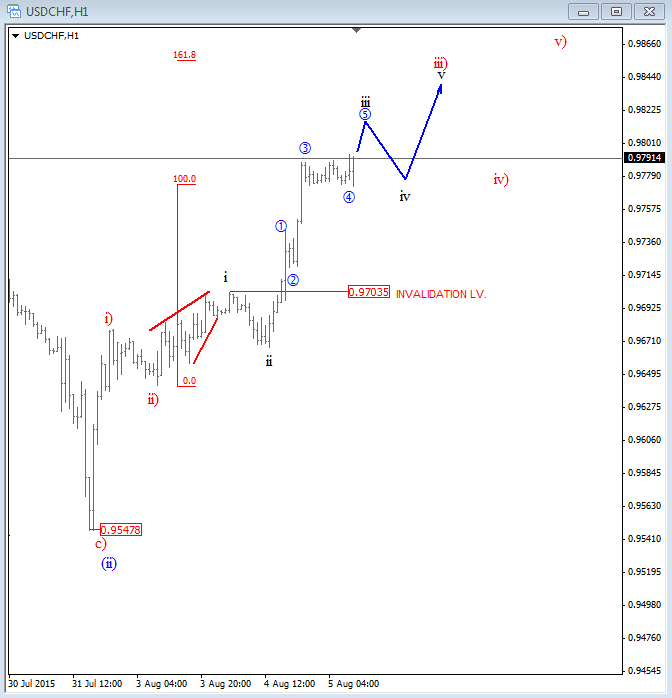 Previous Next Aug 07 2015; German Dax At Intraday Support DAX-wave four at the support 11450-11530. Bounce in view. Try our service today for 1 Month For Only 1€!! .png) Previous Next Aug 11 2015; CORN Be Aware Of More Weakness Corn is bearish again after an impulsive drop from 443'6. Try our service today for 1 Month For Only 1€!! Link to our previous updates on Corn is Here CORN, Weekly .png) CORN, Daily .png) Previous Next Aug 14 2015; EURJPY Forming A Bullish Pattern EURJPY has slowed down into a sideways pattern in the last two days what looks like a corrective move. We see a triangle in wave iv that can be near completion so new swing highs are expected for wave v that can be targeting even 140.00 area. From an invalidation point of view, we will continue to look higher as long as market trades above 137.00. Try our service today for 1 Month For Only 1€!! EURJPY, 30 min .png) Previous Next Aug 17 2015; USDJPY-Bullish H&S Path USDJPY shows a nice bullish Head and Shoulders pattern that can send price up to around 127-128 once 125.30 is out. Try our service today for 1 Month For Only 1€!! .png) Previous Next Aug 18 2015; GBPJPY - Break Out In View GBPJPY is breaking out of a triangle. We are looking towards 197-198 area. Try our service today for 1 Month For Only 1€!! GBPJPY, H4 .png) GBPJPY, H1 .png) Previous Next Aug 19 2015; AUDNZD - Intraday Outlook AUDNZD could bounce from around 1.1050 area. Try our service today for 1 Month For Only 1€!! AUDNZD .png) Previous Next Aug 21 2015; Cocoa : Correction Within Downtrend We expect more weakness after current correction in wave B. Try our service today for 1 Month For Only 1€!! Cocoa, Daily 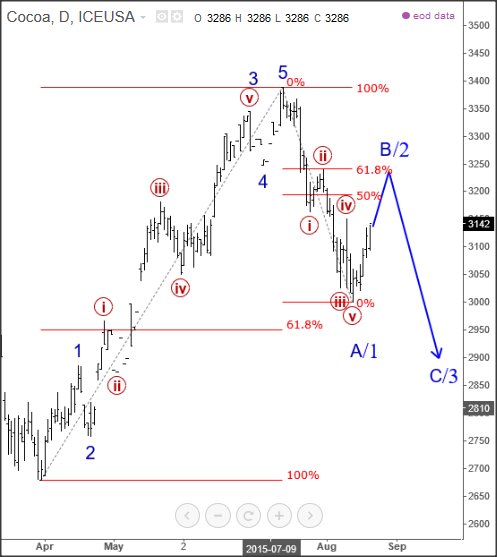 Previous Next Sep 01 2015; EURUSD Intraday Two resistance zones for #EURUSD; 1st one at 1.1312-1.1375 , 2nd important zone (based on Fibo) at 1.1430-1.1500. Try our service today for 1 Month For Only 1€!! .png) Previous Next Sep 01 2015; Crude Oil In A Pullback This is just a temporary set-back on WTI within incomplete bullish run. Support comes in at $41/$43. Try our service today for 1 Month For Only 1€!! .png) Previous Next Sep 09 2015; USDTRY: Uptrend in late stages Try our service today for 1 Month For Only 1€!! USDTRY, D, 4H .png) Previous Next Sep 10 2015; Nifty: Correction Near Completion Try our service today for 1 Month For Only 1€!! Nifty, Daily .png) Nifty, 4H .png) Previous Next Sep 15 2015; EURUSD At Resistance EURUSD could turn down from resistance line. Try our service today for 1 Month For Only 1€!! EURUSD, Daily .png) Previous Next Sep 16 2015; EURCAD Looking Bearish Try our service today for 1 Month For Only 1€!! EURCAD, 4H .png) Previous Next Sep 17 2015; Corn Looking To Continue Lower Try our service today for 1 Month For Only 1€!! Corn, Weekly, Daily .png) Previous Next Sep 21 2015; EURUSD Looking Bearish Try our service today for 1 Month For Only 1€!! EURUSD, 30 min .png) Previous Next 22.9.2015; EURCAD Is Headed Lower Try our service today for 1 Month For Only 1€!! EURCAD, 4H .png) Previous Next Sep 24 2015; GBPJPY In Final Stages Of A Big Trend Try our service today for 1 Month For Only 1€!! GBPJPY, Daily 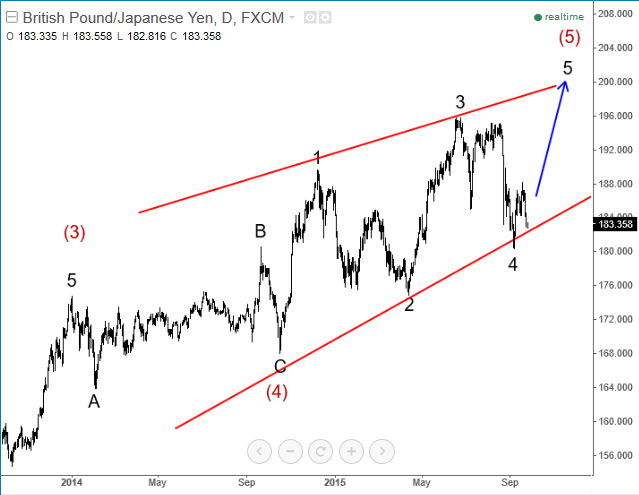 Previous Next Sep 24 2015; GOLD and Silver Silver is weaker than gold but overlap with 15.10 suggests that price should go higher. That said, stronger gold should have no problems targeting 1170 from Aug 24. Try our service today for 1 Month For Only 1€!!
Previous Next Sep 28 2015; Sugar Moving As Predicted New highs on Sugar are already here as expected from last week. Try our service today for 1 Month For Only 1€!! Sugar, 1h 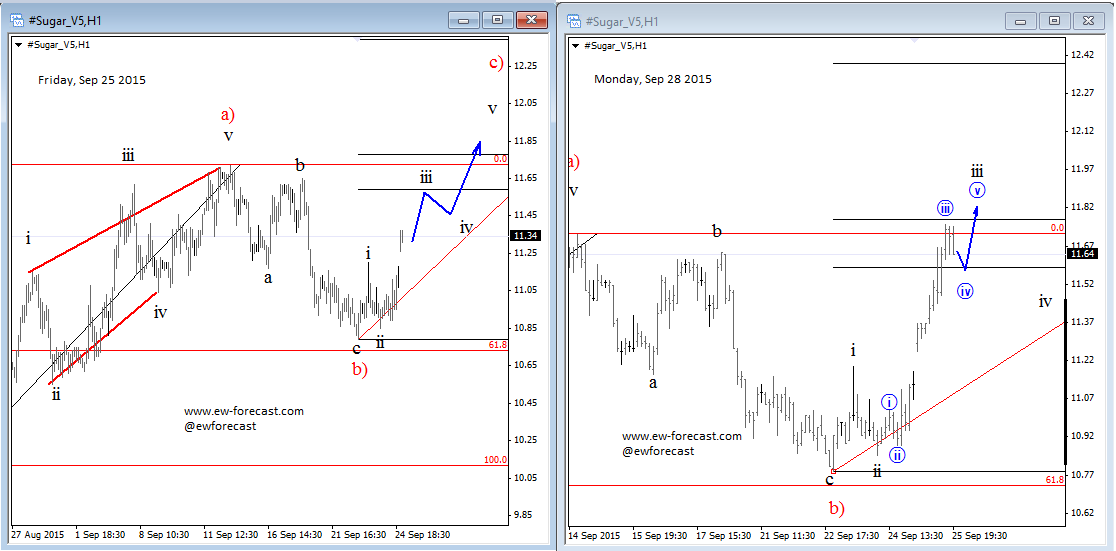 Previous Next Sep 28 2015; German Dax Intraday Price can be looking for some support around 9500. Try our service today for 1 Month For Only 1€!! German Dax, 15 min 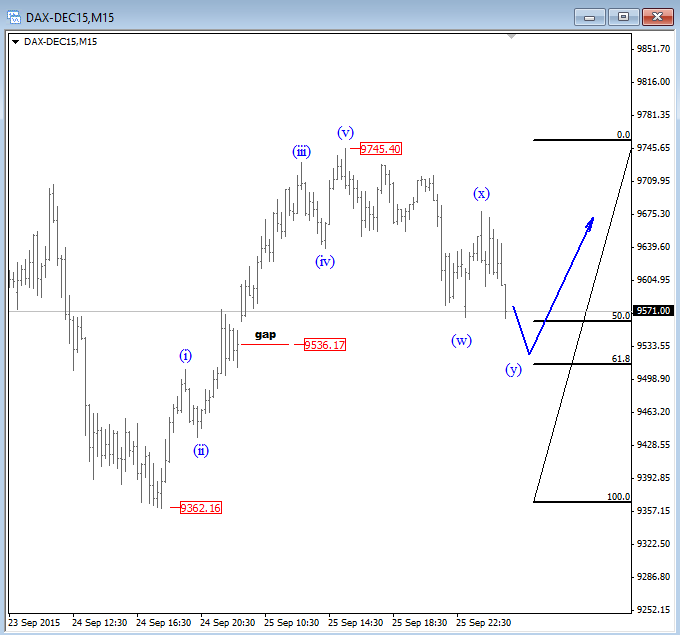 Previous Next Sep 30 2015; GBPCAD : Pair May Go Lower Pair is now trading in a three wave pull-back which consist out of three waves (a), (b) and (c). Wave (c) may reach lower levels before turning up. Try our service today for 1 Month For Only 1€!! GBPCAD, Daily 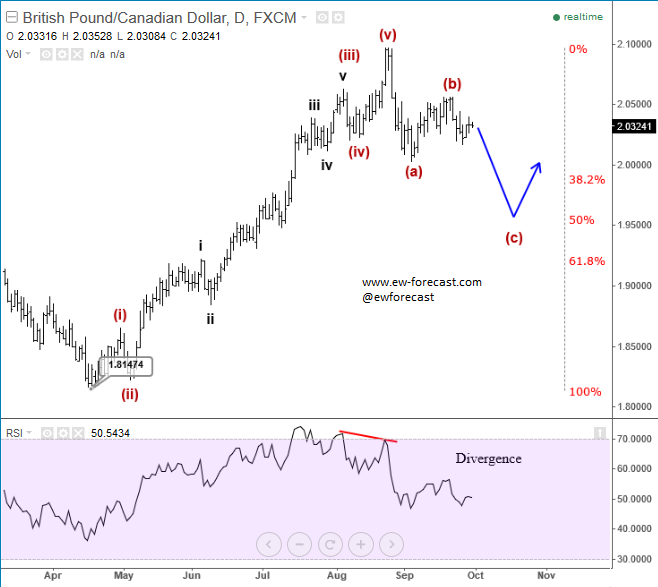 Previous Next Oct 05 2015; EURCAD: Price Is Looking Bearish Price may still go higher in blue wave c, before turning down into black wave (iii). EURCAD, 15 min 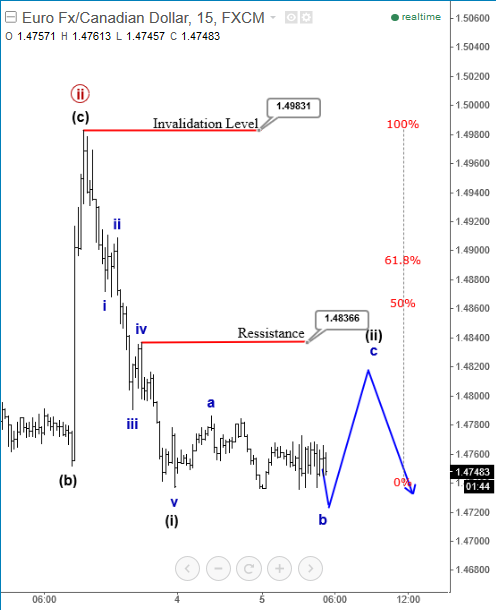 Previous Next Oct 05 2015; NFP and S&P500- Technicals Won Again Were you bullish or bearish on US stocks after bad NFP report on Friday. Well pattern was clearly bullish! A flashback chart: 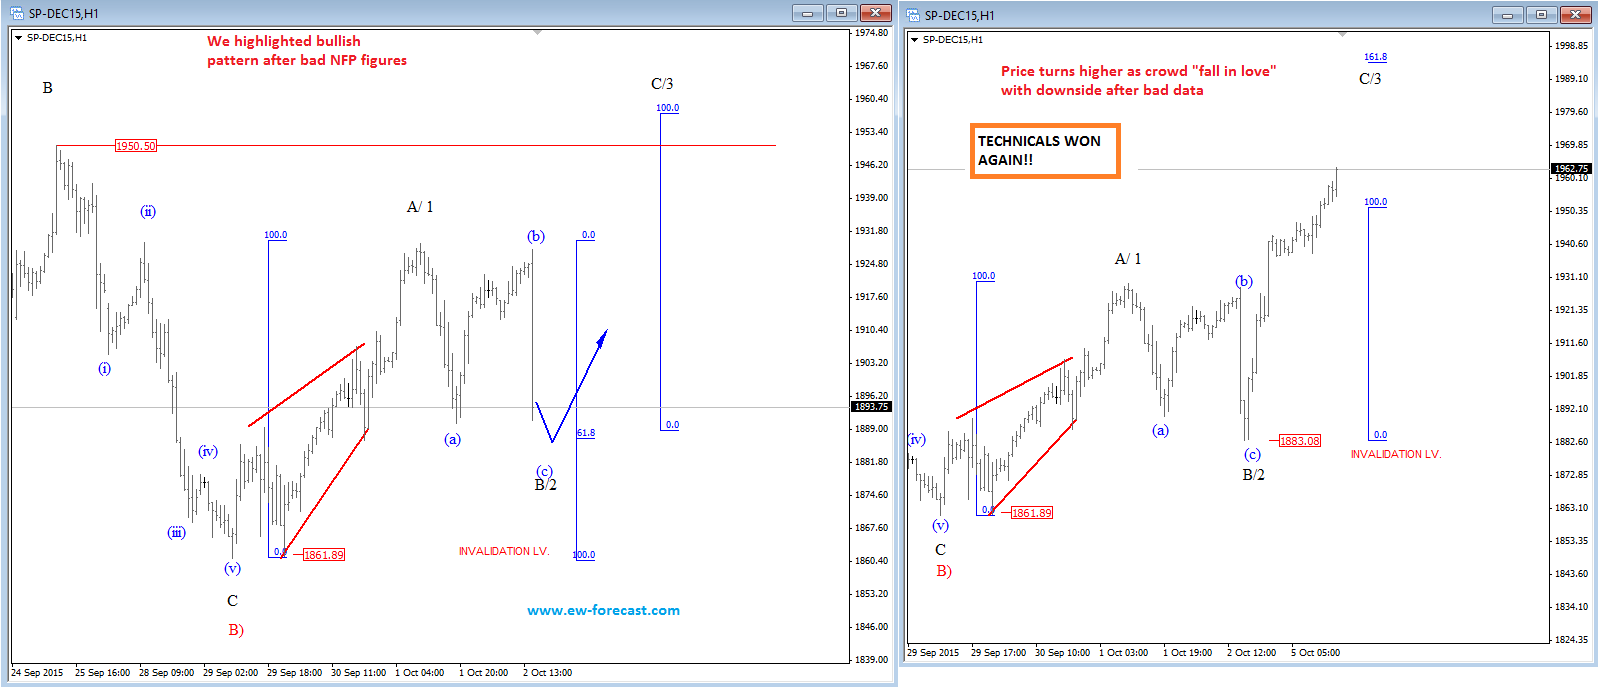 Previous Next Oct 07 2015; NZDUSD : Bullish Impulse In Play NZDUSD, 2H .png) Previous Next Oct 08 2015; S&P500 Intraday Bullish Structure Triangle on the S&P500 is pointing up to 2010-2020 zone. S&P500, 1h 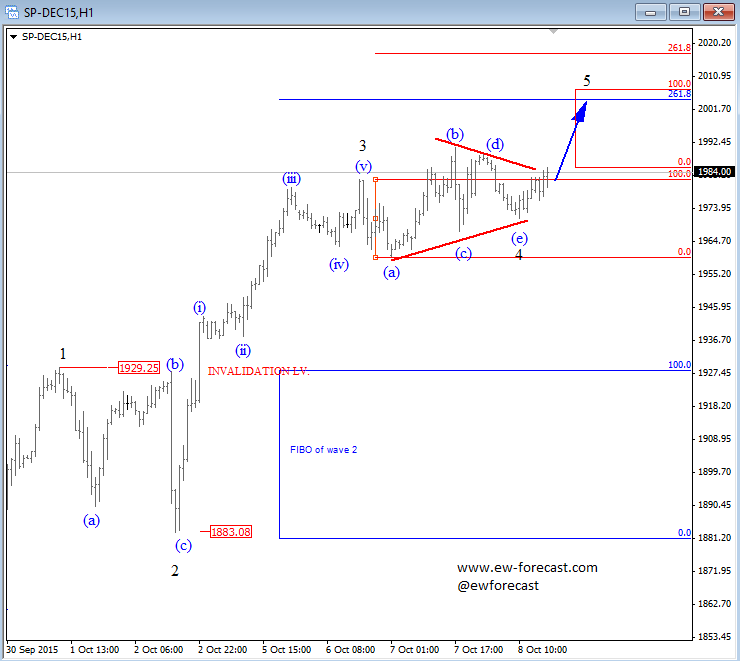 Previous Next Oct 12 2015; EURUSD : Recovery On EUR Is Looking Corrective EURUSD, 4H 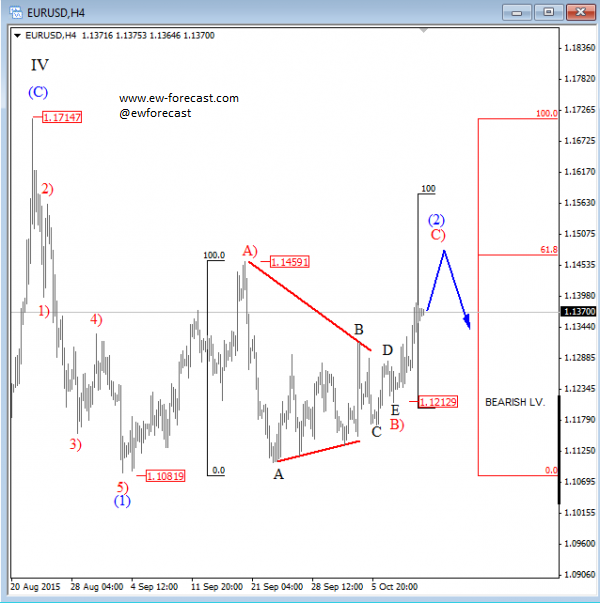 VIDEO Oct 14 2015 Previous Next Oct 13 2015, Good Old Positive Correlation It's very interesting to see GOLD, AUDUSD and S&P500 up at the same time. .png) Previous Next Oct 15 2015, Sugar Is Still Looking Up Sugar has a nice looking structure and could reach higher levels after the recent pull back in red wave 4). Sugar, 4h and 1h .png) Previous Next Oct 26 2015; EURUSD Is Moving Down More Weakness is expected in days ahead, after temporary pull back in wave 4. EURUSD, 4H 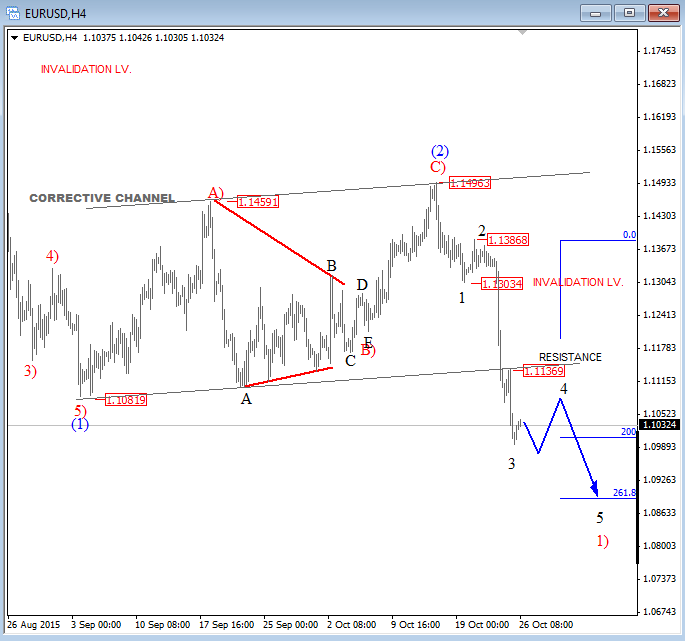 Previous Next Oct 27 2015; CORN : Bearish Momentum CORN, Daily 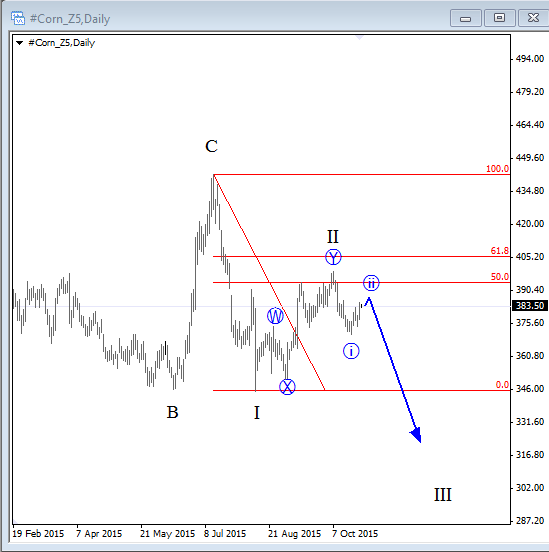 CORN, 4H 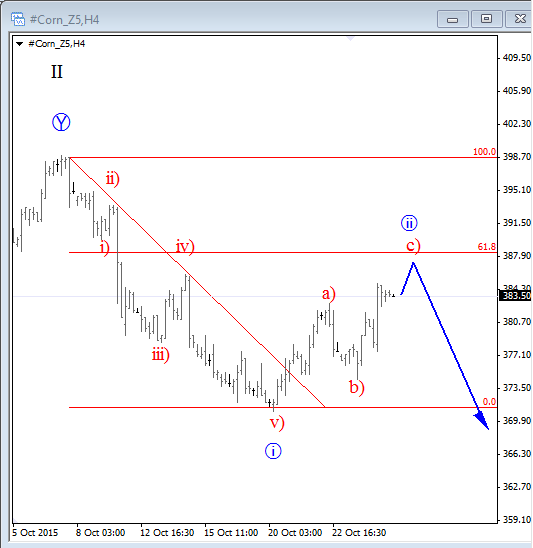 Previous Next Oct 28 2015; AUDUSD : Intraday Weakness Intraday downtrend has room for 0.7070-0.7100. AUDUSD, 30 min  Previous Next Oct 30 2015; S&P500 : Upside Can Be Limited There is room for 2100 but think that sooner or later new reversal down will occur. S&P500, 4H  Previous Next Nov 02 2015; USDCAD : Bulls In Play On the USDCAD chart, uptrend may continue this week as decline frome 1.3280 is already in three waves. USDCAD, 4H 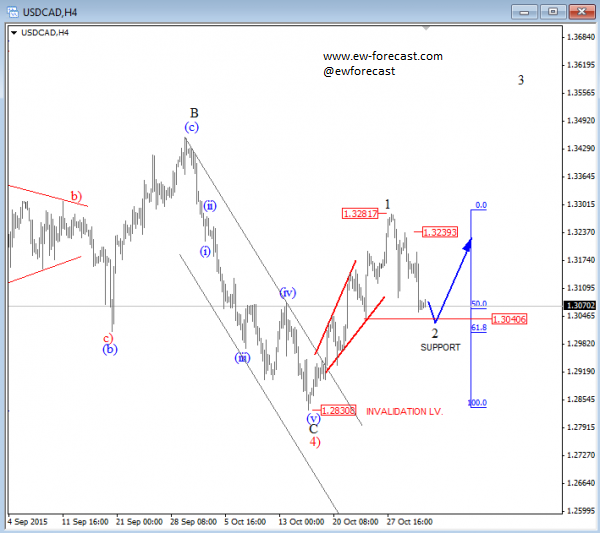 Previous Next Nov 04 2015; Wheat Is Expected To Go Lower Wheat has still some room for weakness to complete black wave 5. Wheat, Weekly  Previous Next Nov 10 2015; GBPUSD : Lower Levels In View Market is expected to continue lower from current levels towards 1.5000 psychological level. GBPUSD, 4H 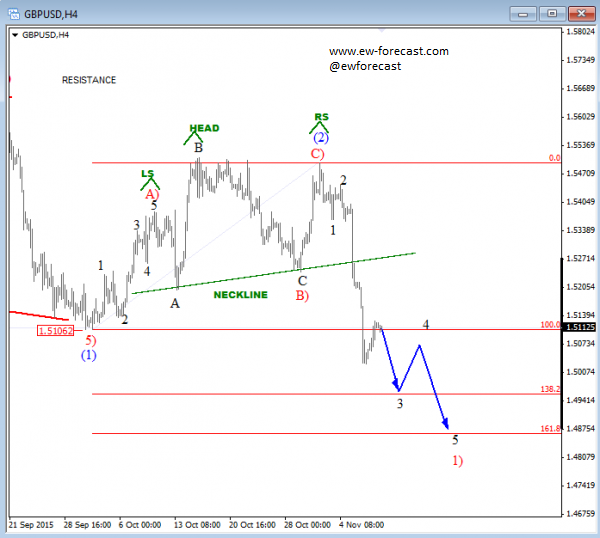 Previous Next Nov 12 2015; CORN Now and Then CORN, 4H  Previous Next Nov 17 2015; AUDNZD : Pullback In Sight Price made a five wave sequence to the upside in black wave 1, thus meaning there could be a three wave correction in play in session ahead. AUDNZD, 4H 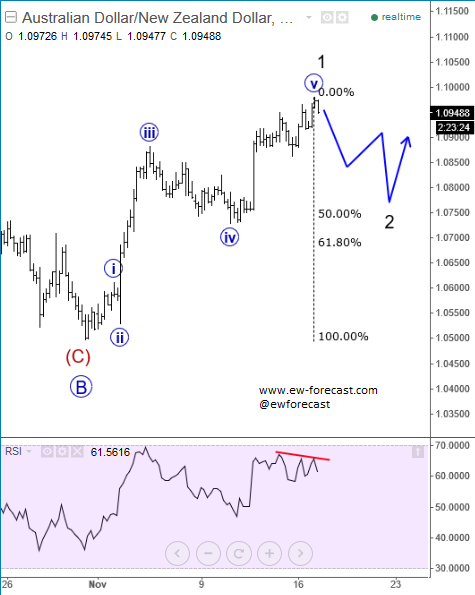 Previous Next Nov 25 2015; Bearish Triangle On Gold New lows on Gold can occur soon. GOLD, 4H 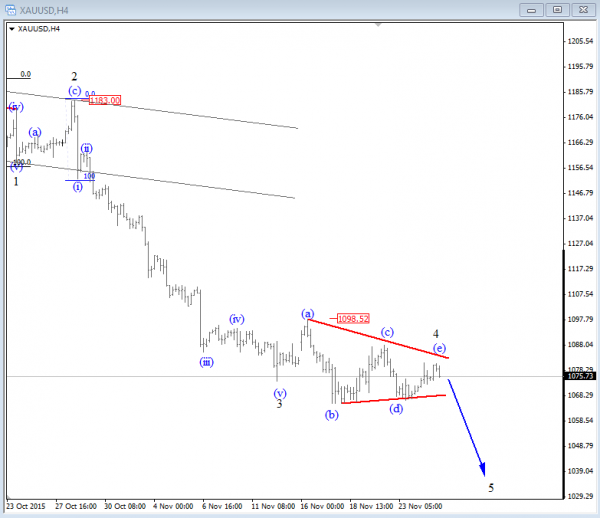 Previous Next Dec 01 2015; USDTRY : Flashback Chart 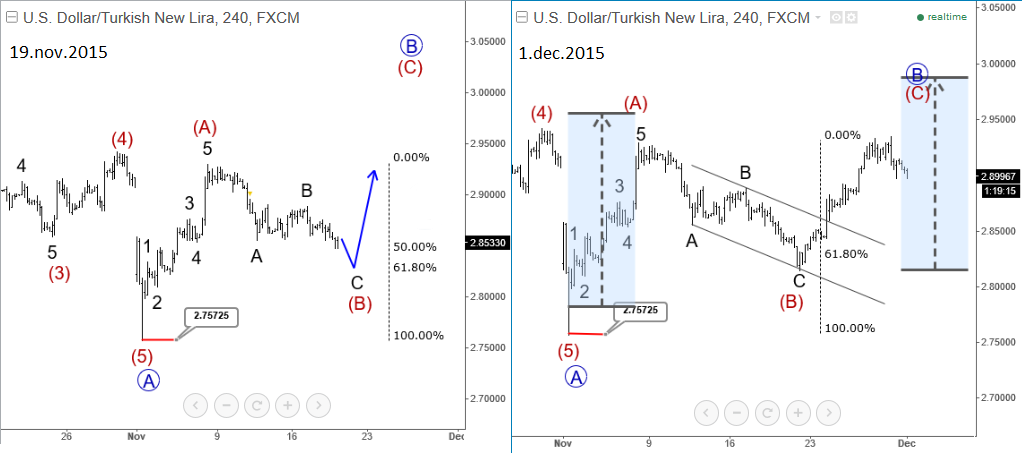 Previous Next Dec 07 2015; USDJPY : Triangle Pointing Up Triangle is pointing to a new high. USDJPY, 4H 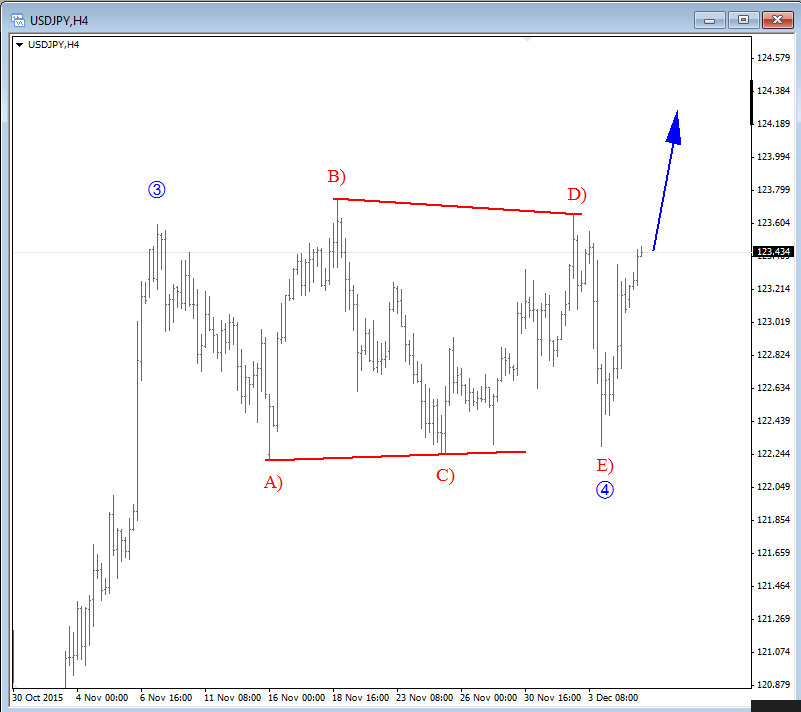 Previous Next Dec 15 2015; GBPAUD Is Turning Bearish GBPAUD, 30 Min 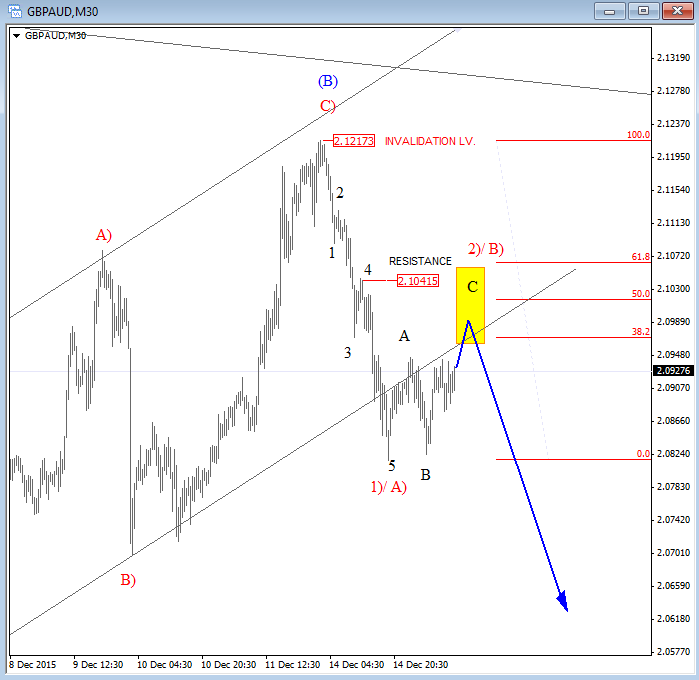 Previous Next Dec 18 2015; USDCAD At 1.4 Psycho Level Minor Intraday pullback on USDCAD from the highs can be corrective. Will pair hit 1.40!? USDCAD, 1H 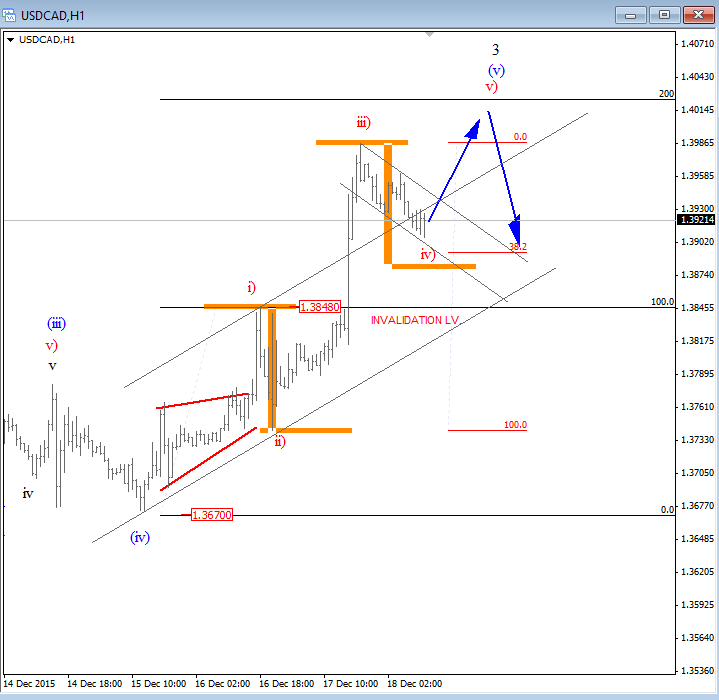 Previous Next Dec 22 2015; DAX : More Upside In View More gains could follow into the year end as we see wave (2) near completion. German DAX, 4H .png) Previous Next Jan 04 2016; EURAUD Is Looking Up EURAUD can be turning bullish, based on the Elliott wave pattern, especially if daily candlestick remains strong by the end of the day. EURAUD, 4H  Previous Next Jan 20 2016; GBPAUD : More Upside In View More upside could be seen in sessions ahead, as price looks to have completed the correction in black wave B. For more analysis like this, register HERE GBPAUD, 4H 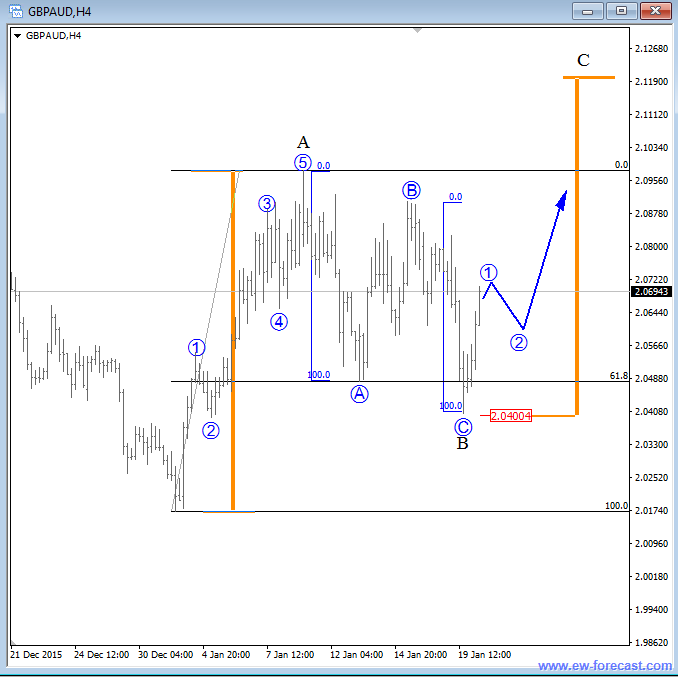 Previous Next Jan 28 2016; S&P500 : Bears Still In Play S&P500 looks to be trading in a correction in wave 4. This correction can be limited near the lower channel line and the 38.2 fibo. ration, where a reversal may occur. If you like our analysis please vote for us "Best Analysis", Answer "Elliott Wave Corner" by EW-Forecast Vote Here: http://goo.gl/mnpZfY For more analysis like this, register HERE S&P500, 4H .png) Previous Next Feb 22 2016; Corrective Decline On GOLD Gold is trading nicely to the upside, displaying a nice impulsive structure from the low of blue wave 2-circled. Currently metal in a correction in wave 4 and could still decline towards the trendline support, before making a reversal to higher levels in wave 5. For more analysis like this, register HERE GOLD, 4H .png) Previous Next Mar 08 2016; EURGBP Approaching Resistance Intraday correction on EURGBP is slowly approaching resistance at 0.78125, where a change in trend may happen towards lower levels in wave C). For more analysis like this, register HERE EURGBP, 1H 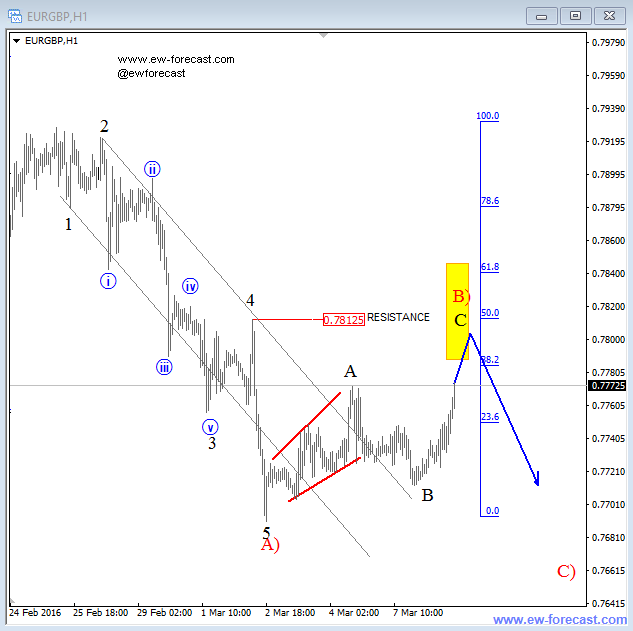 Previous Next Mar 11 2016; EURUSD Displaying H&S EURUSD may not be so bullish as it looks right now. Potential reversal points near 1.1200 had been reached. We are waiting on weakness back towards 1.1000 to confirm lower prices ahead. For more analysis like this, register HERE EURUSD, Daily 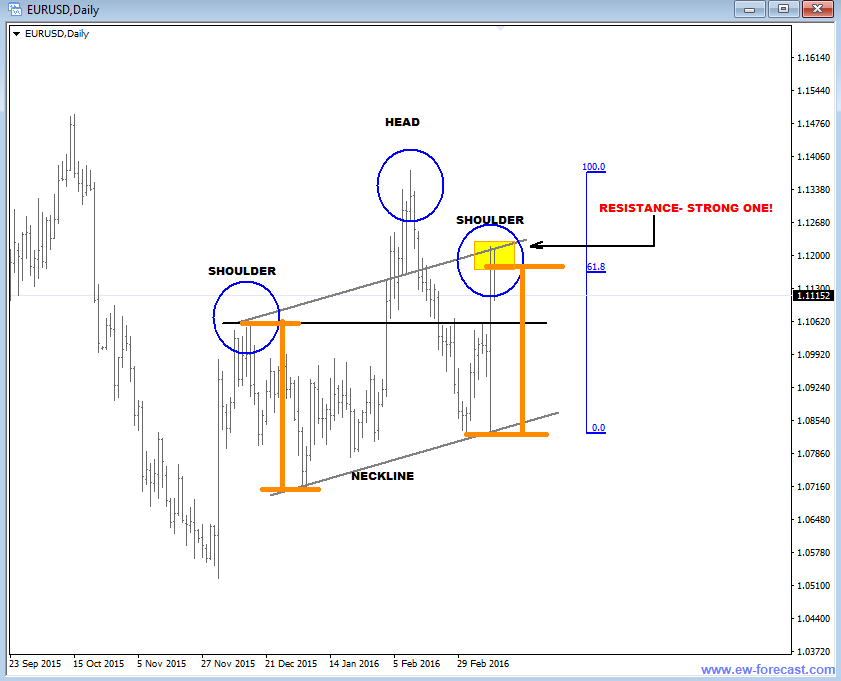 Previous Next Mar 24 2016; GBPUSD Turning Bearish GBPUSD keeps trading bearish, breaking beneath the lower channel line and suggesting that more weakness could be in store after a minor correction in wave 2. For more analysis like this, you can register HERE GBPUSD, 4H 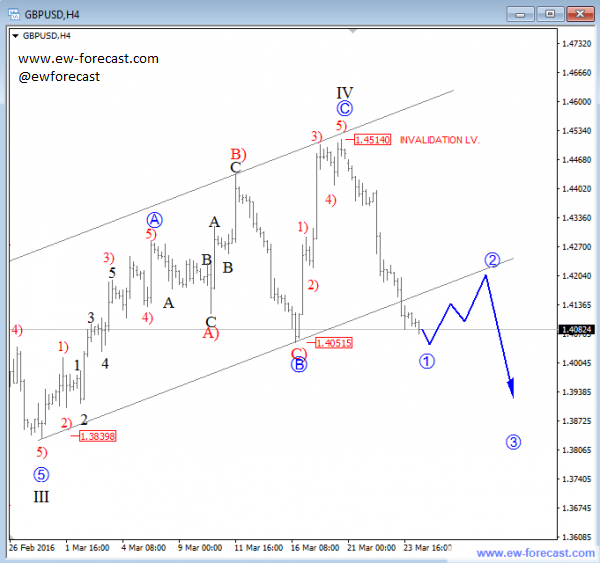 Previous Next Apr 12 2016; Gap Reversals On DAX Notice that in the last few examples, DAX has always changed a direction after an open gap was filled. So the question is; Will DAX make a new leg down to around 9430/70?  DAX, 1H 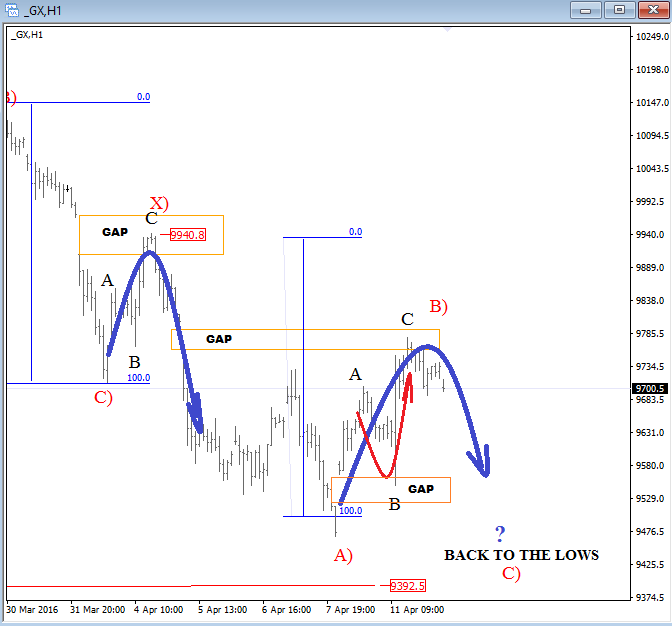 Previous Next May 20 2016; Triangle On DAX German DAX can stay under pressure, as we see triangle unfolding.  German DAX, 1H 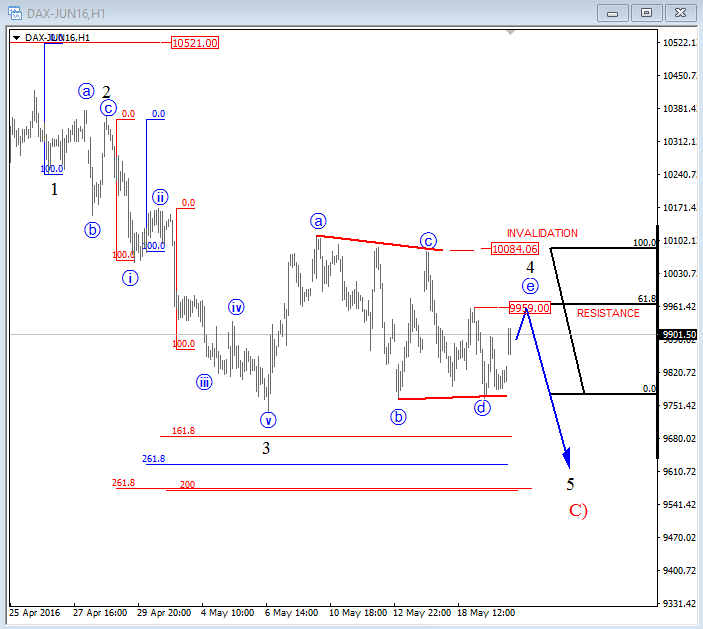 Previous Next May 31 2016; CADJPY Ideally Reaching Lower CADJPY gives an idea of a possible new bearish cycle taking place in weeks and months ahead. CADJPY, Daily  Previous Next June 02 2016; FTSE 100 Footsie is now at potential resistance. More weakness can be coming while beneath 6277. FTSE, Daily .png) .jpg) Previous Next June 14 2016; VIX Cycle and 61.8 Fib. VIX, also known as "fear index" is higher as stocks turned down recently, but pay attention to that cycle with lower highs and 61.8% Fibonacci reversals. So we are wondering if pattern can repeat and cause a new leg down here, thus bullish continuation on equities? VIX Daily 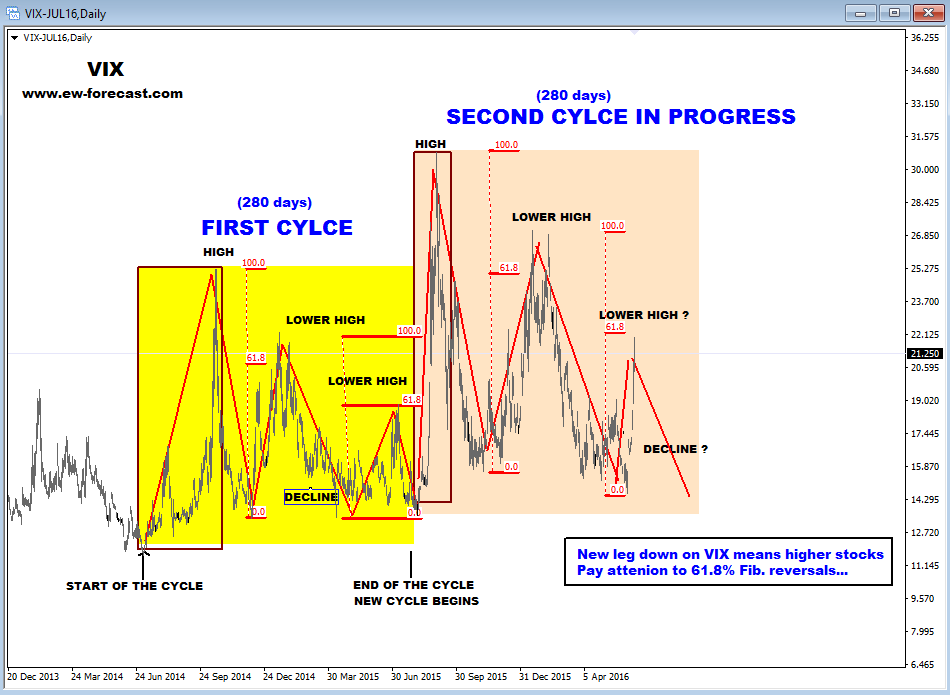 Previous Next June 22 2016; DAX Facing Intraday Correction Patiently waiting on a corrective set-back. Wave count and open gap suggest that temporary turn down may be around the corner. German DAX, 1H 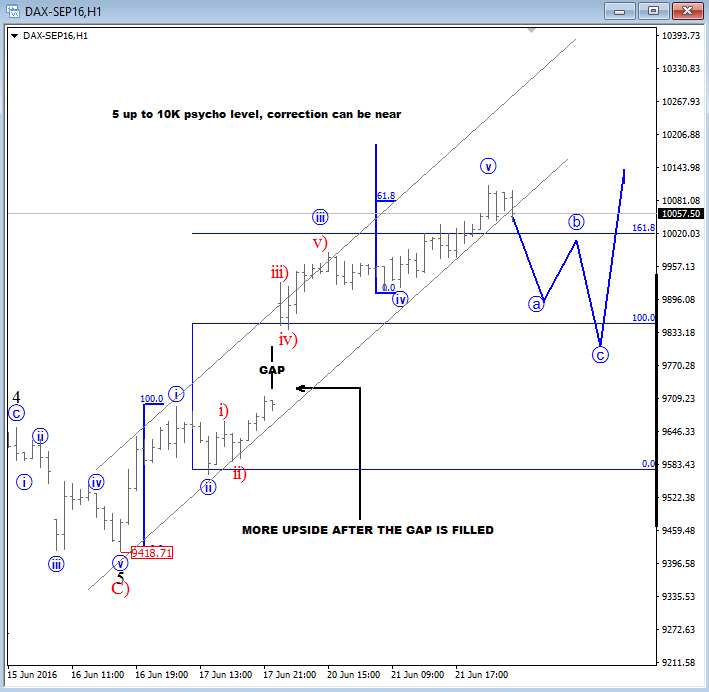 Previous Next June 23 2016; Cable Looking For A Top GBPUSD, 30Min 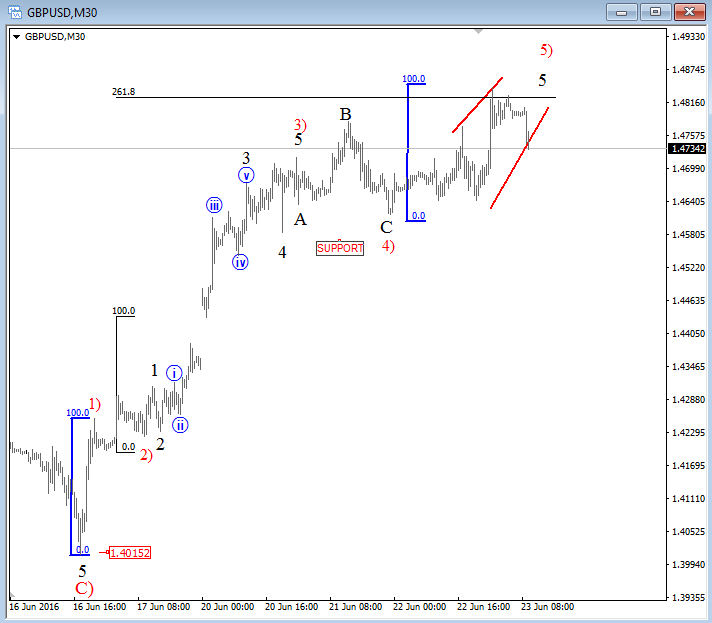 Previous Next June 29 2016; FTSE 100: Post Brexit Analysis Charts below of the FTSE 100 shows an example of high accuracy prediction based on Elliott Wave theory. FTSE 100, 30Min (Monday, June 27, 2016) .png) FTSE 100, 30Min (Wednesday, June 29, 2016) 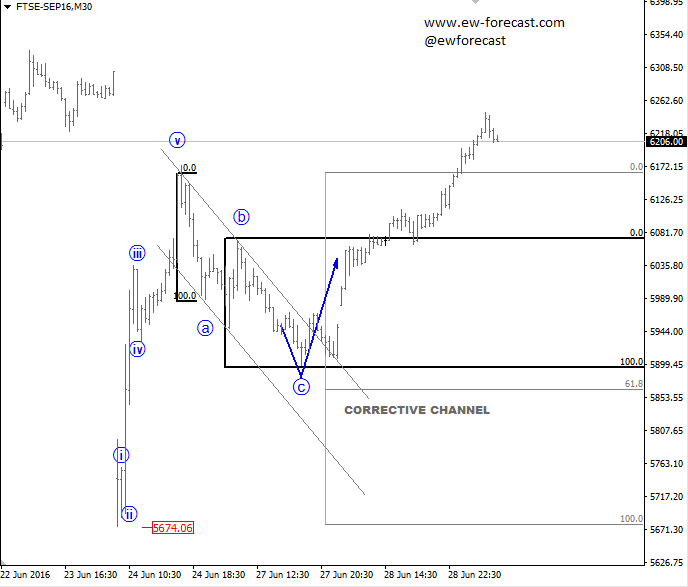 Previous Next July 12 2016; Crude Oil Latest decline on crude oil is slow and overlapping; a correction that can send price to new highs of 2016. Break above the channel line will likely put more bullish momentum in play. 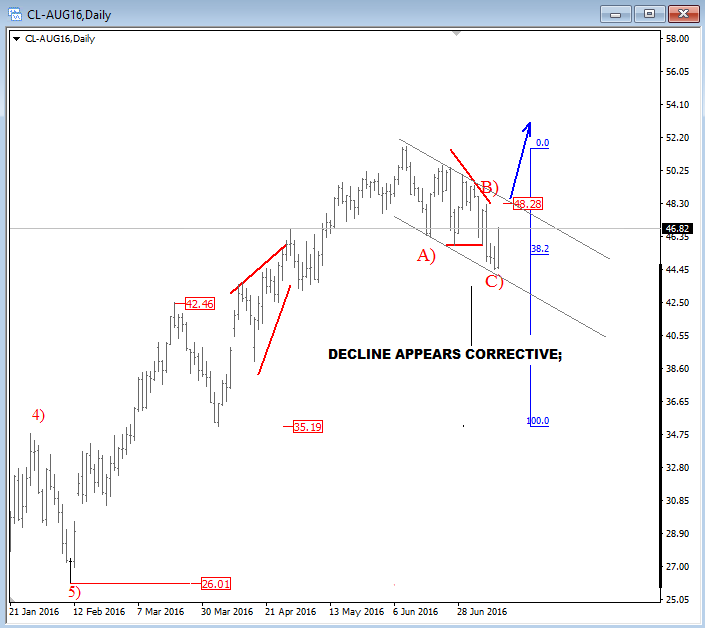 Previous Next July 13 2016; Silver Silver can see more upside while above 19.20. .png) Previous Next July 19 2016; Aussie At Technical Resistance
Previous Next Aug 01 2016; EURGBP At Resistance Former wave four, 61.8% Fibonacci level and ending diagonal in wave C suggest that current recovery may face limited upside soon. 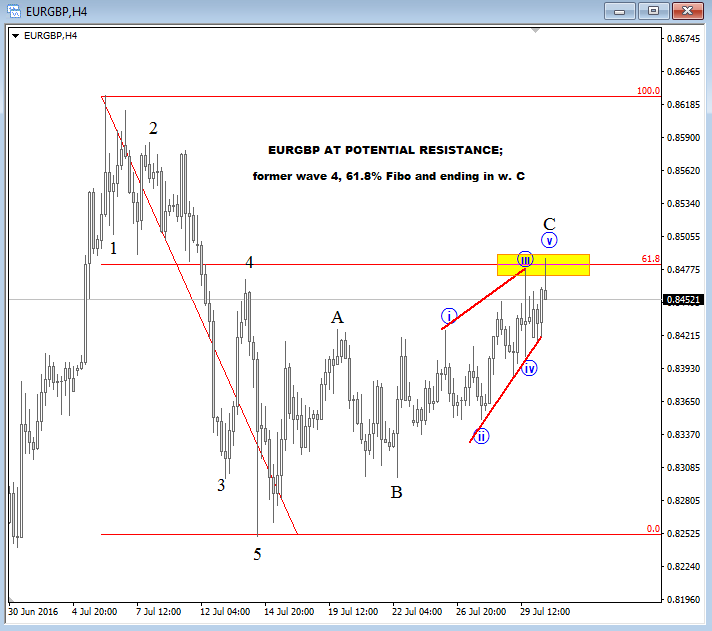 Previous Next Aug 09 2016; E-mini S&P500 Bullish intraday structure on E-mini S&P500 suggests that we can see more upside in the very near-term while price trades above 2164. .png) Previous Next Aug 15 2016; DAX In Wave 5
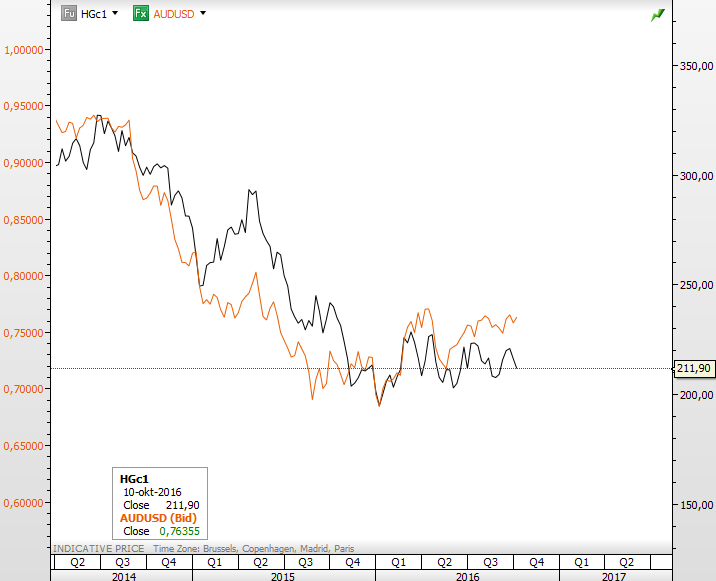
Previous Next Sep 06 2016; Intraday Bullish Dax Intraday structure on German Dax suggests that index may see more upside in the next few sessions as recent pullback to 10660 appears corrective. Can we see 10800 this week? .png) Previous Next Oct 10 2016; Bullish H&S On Crude Oil Decisive break above 52.50 can open door for 63.20 and then even 76.00. Crude Oil, Weekly 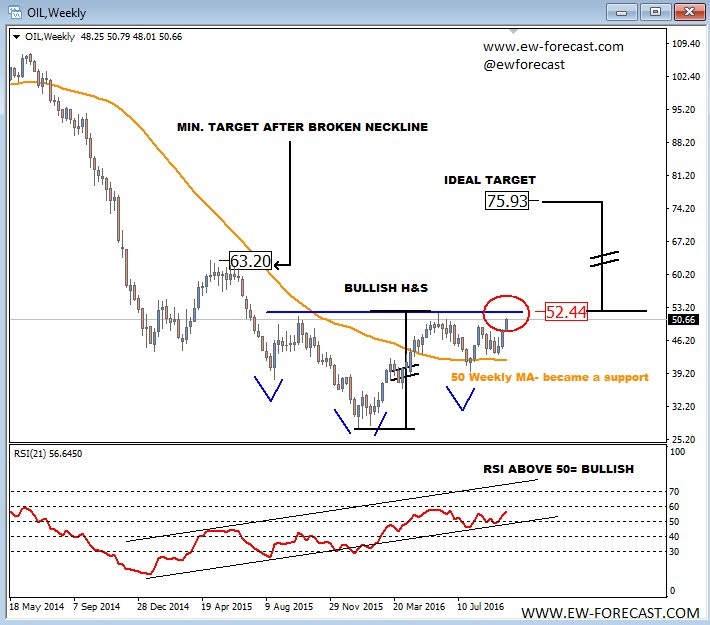 Previous Next Oct 14 2016; Breakdown On Copper Can Limit Aussie Gains I'm expecting drop on Aussie by the year end, but guess will have to wait on breakdown on copper first to pull AUD/USD lower.
 Previous Next Oct 18 2016; 10 year US notes vs EURUSD More upside on 10 year US notes into wave C suggests that EURUSD can also retrace back to 1.1050/1.1060 resistance based on positive correlation.
Previous Next
Nov 02 2016; Corrective Pullback On S&P500 We see a three wave decline on E-mini S&P500, with a triangle in the middle, so current leg down can be temporary with first support seen at 2080 followed by the next one at 2060 area. This market may not be so bearish as it seems...
Previous Next Nov 14 2016; Pre and Post US Election Charts Below we can see the EURUSD and DAX before the results of the election and post election. (Click on the chart for a higher resolution) (3).png) Previous Next Nov 15 2016; Bulls Taking Over The S&P Now when stocks are in bullish mode, that trendline on S&P can be interesting, near the 2130 region.
Previous Next Nov 24 2016; NASDAQ Could See Limited Upside Despite recent strong turn up on stocks since the US elections, we see some patterns that suggests limited gains in months ahead. It can be an ending diagonal here on NASDAQ100; a strong reversal pattern that can put market in bearish mode in 2017. NASDAQ, Daily .png) Previous Next Dec 20 2016; USDJPY Can Hit 120.00 The S&P500 could help the USDJPY to hit 120.00. S&P500(4h) and USDJPY(Weekly) .png)  Previous Next Dec 21 2016; Silver Short-term Elliott wave structure and hammer candlestick on daily chart suggest that metal can see higher prices in the near-term. 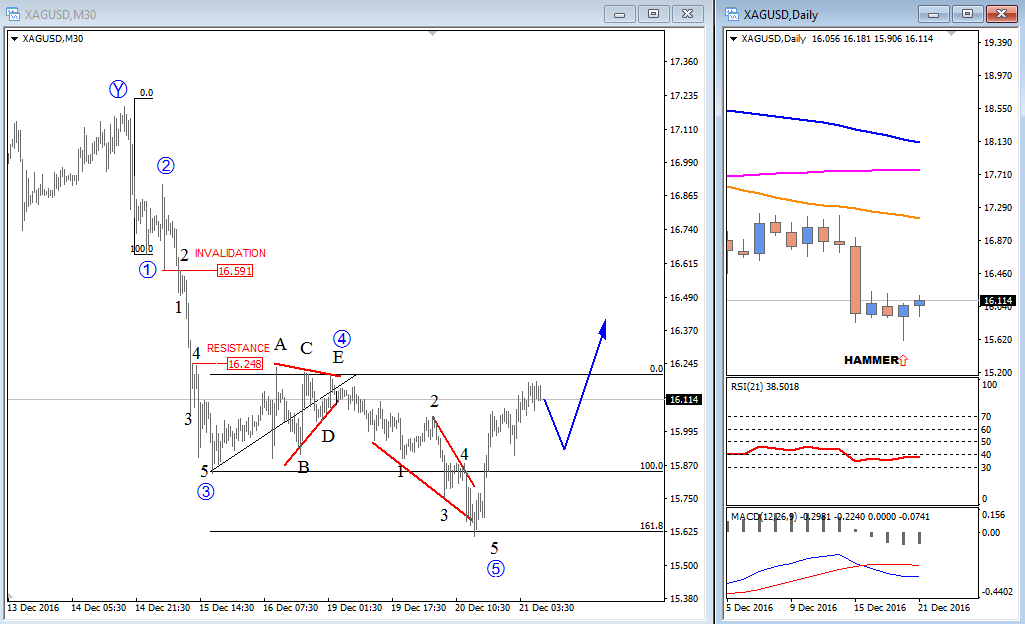 Previous Next January 03 2017; USDCAD My favorite pair for start of 2017, based on Elliott Wave structure, is USDCAD. We have clear five waves down while bounce is already looking corrective to the upside, so we can assume that next major move will be lower. 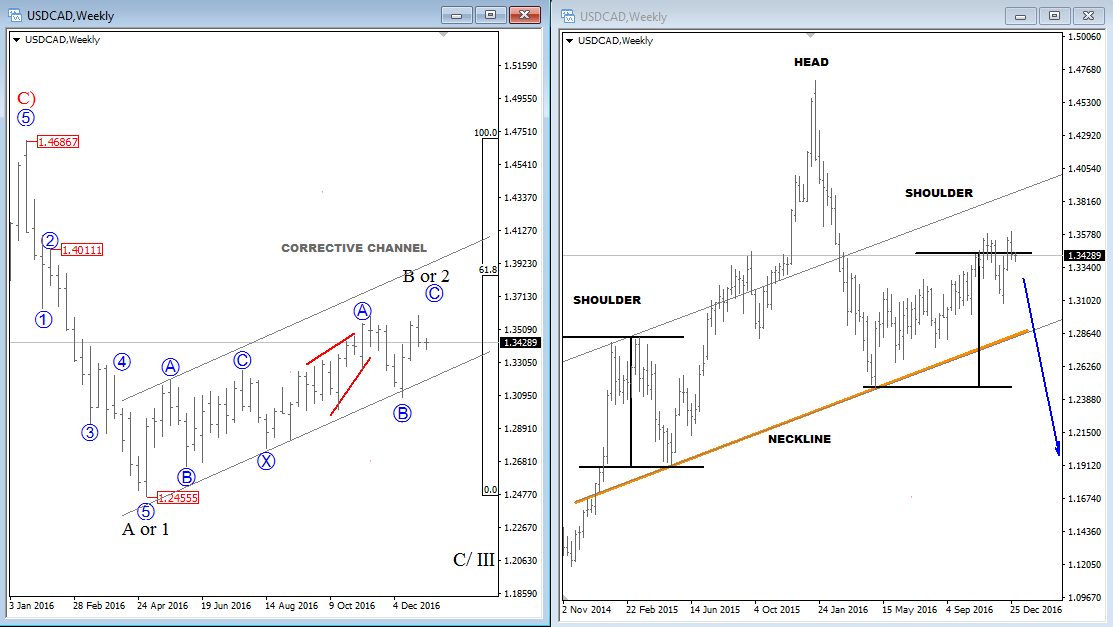 Previous Next Jan 12 2017; Zig-Zag On DX
Trump sent buck down yesterday, but don't fall in love with USD weakness too soon. Higher degree trend is still up while intraday charts has three waves down, now near support. .png) Previous Next Jan 31 2017; Time And Cycle Analysis For S&P500 Longer term, time and cycle analysis on S&P500 highlights 2500 price but month of February 2018 may also be very important. .png) Previous Next Feb 07 2017; EURUSD and USDJPY Video Previous Next Feb 21 2017; Nikkei vs USDJPY Nikkei has a continuation pattern which can send price to a new high soon, so USDJPY may see more upside as well based on positive correlation. .png) Previous Next Mar 06 2017; Intraday Turn On S&P 500 Futures Impulsive fall from the high suggests that minimum three wave decline of a higher degree is here. 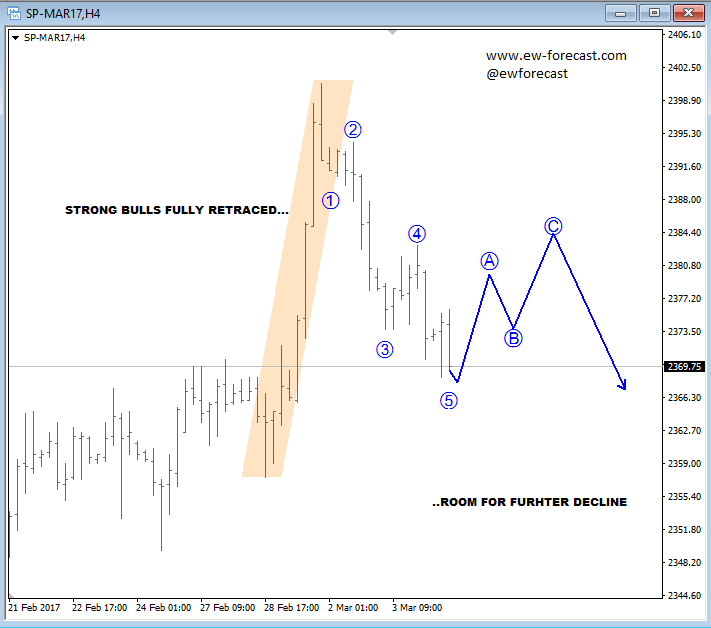 Previous Next Apr 12 2017; GBPUSD Cable is looking interesting from a bullish perspective as bounce from 1.2364 (April 07 low) appears to be in impulsive fashion, so pullbacks may be opportunity to join the uptrend. Watch out for three wave set-backs. .png) Previous Next Apr 25 2017; Intraday Strength On USDCAD USDCAD in showing a five wave move from April 12 low, so reversal may follow in the near-future. First resistance is near 1.3580, and next one is seen around 1.3680. .png) Previous Next Apr 28 2017; Sugar Searching Support Sugar appears to be trading near interesting, potential support levels based on Elliott Wave structure as well as maybe "too much" bearish sentiment. Also, higher degree cycle shows a potential contra-trend move in three legs. Rise above wave four would be first step towards a trend-change. .png) Previous Next May 15 2017; Intraday Crude oil Crude oil is moving into some interesting Fib. levels near 49.  Previous Next May 17 2017; NZDJPY and its correlation with E-mini S&P500 This is an intraday view of NZDJPY published on May 12 Previous Next May 22 2017; DAX Dax may see another leg down, into wave C) back to 12380/12400 area while below 12840. 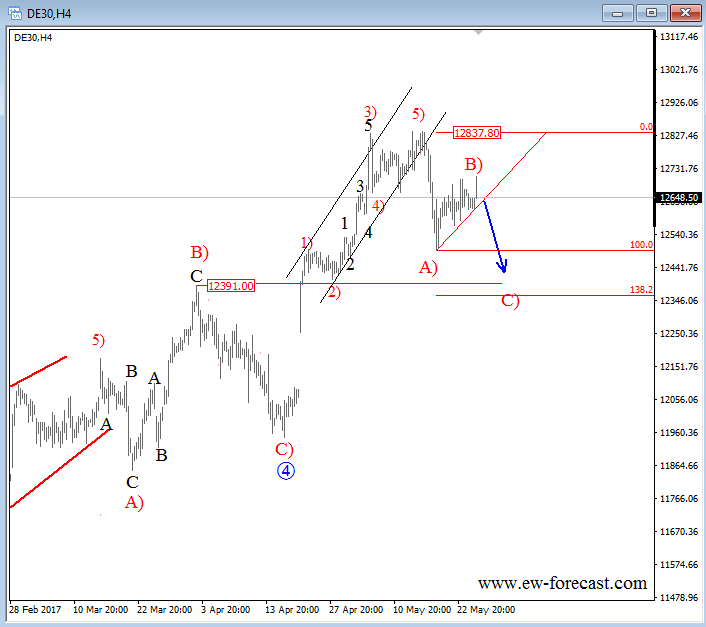 Want More Information about Elliott Wave Cycles In real Time?  Previous Next June 02 2017; USDCAD Intra-day Correction Three wave rally on USDCAD back to former wave four looks like a nice corrective bounce as part of a downtrend. Is new leg down coming?! USDCAD, 1H .png) Want More Information about Elliott Wave Cycles In real Time? Previous Next June 07 2017; Intraday Bullish Gold Gold appears to be in nice strong uptrend that may break to a new high of the year. A decisive breakout may open room even for 1337, Nov 09 2016 "Trump Level". .png) Want More Information about Elliott Wave Cycles In real Time?
Previous Next June 21 2017; LISK Currency Looking Higher As we can see Lisk is trading bullish since March of 2017, and can be now trading within the final stages of a fourth wave correction. On the 1h chart we can see a triangle correction in the making, with recent price activity unfolding as a sub-wave E, final leg of a triangle. If that is the case, then more gain may follow on the virtual currency. A confirmation point of view for more gains would be a breach above the wave D and B swings. Lisk, 4h 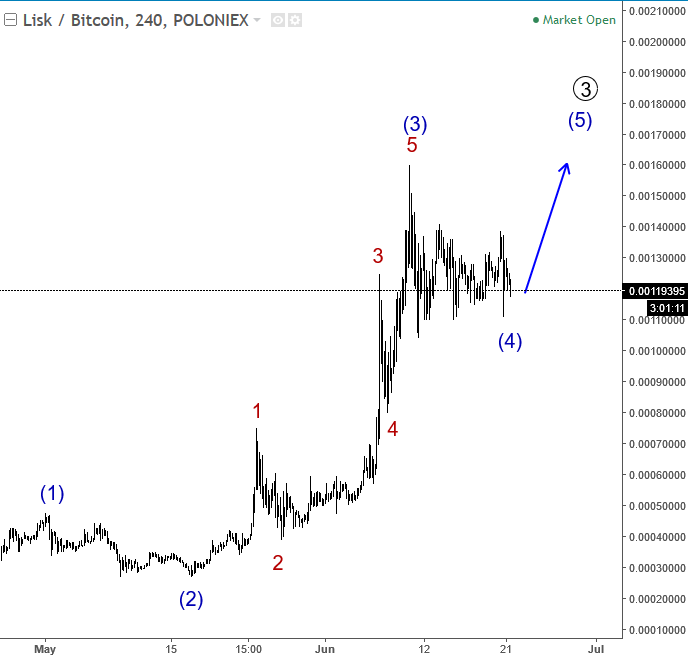 Lisk, 1h 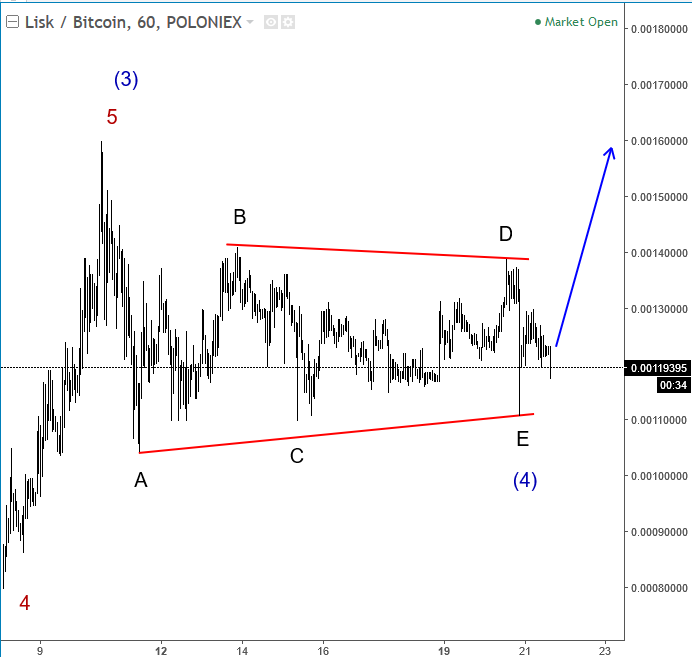 Want More Information about Elliott Wave Cycles In real Time?
Previous Next July 07 2017; USDCAD Intraday Structure USDCAD is in a three wave rise ahead of todays US and Canadian data. Resistance seen at 1.3015. USDCAD, 1H  Want More Information about Elliott Wave Cycles In real Time?
Previous Next July 10 2017; USDCHF Intraday USDCHF is shows a five wave rally and three wave decline; it's clear bullish pattern that is pointing to 0.9686 again while market is above 0.9552 low. .png) Want More Information about Elliott Wave Cycles In real Time?
Previous Next Aug 30 2017; Nikkei 225 Remains Bullish Nikkei 225 Index is in clear uptrend with higher highs and higher swing lows, currently at the trendline support. So rather than fighting a trend, it's maybe easier to follow it for a fifth wave up. Nikkei 225, Daily .png)
Want More Information about Elliott Wave Cycles In real Time? Previous Next Sep 25 2017; Corrective Set-back On EURJPY We see stocks making a correction within uptrend, so we suspect that sooner or later price will be higher. That said, XXX/JPY pairs may stay in uptrend as well. EURJPY can be interesting; support at 133.00. .png) Want More Information about Elliott Wave Cycles In real Time? Previous Next Sep 26 2017; Nikkei225 In Wave 4 Correction Nikkei was lower during Asia, but price settles down after 3-waves of retracement. Now looking bullish for 5 up. More JPY weakness? 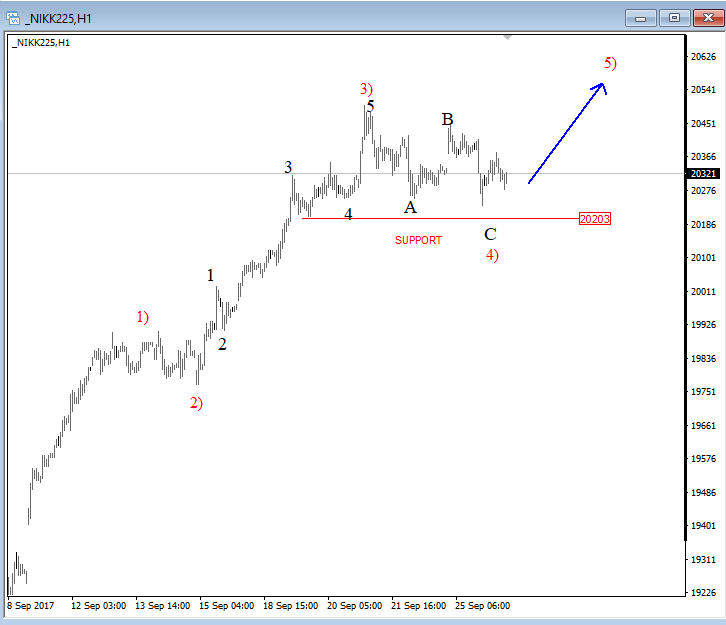 Want More Information about Elliott Wave Cycles In real Time? Previous Next Oct 03 2017; EURUSD Trading Near Support Markets in Germany are closed today due to German Unity Day, so EURUSD may not move much, unless we get some strong USD reactions later today. Technically speaking, we see EURUSD pair trading into some interesting support area here at 1.1700 where pair may bounce if we consider a fifth wave down right into some interesting old swing levels on a weekly basis that may turn into a support. There is also 200SMA that may cause a turn in the second part of this week. EURUSD, 1H and Weekly .png) Want More Information about Elliott Wave Cycles In real Time? Oct 05 2017; Resumption Of An uptrend On USDTRY After nice 9 months of a corrective set-back, USDTRY is again showing signs of a recovery after recently broken channel line on a daily chart. USDTRY, Weekly and Daily .png) Previous Next
Stocks are waiting FOMC when markets may again break to new highs if we consider recent structure on E-mini S&P500; it's a triangle that is pointing higher into wave 5, towards 2560. A triangle correction is an Elliott wave pattern, that unfolds prior to the final wave, meaning once fully unfolded a new and final push into the direction of the trend may follow. In our case this is to the upside. A triangle pattern consist out of five waves and usually each of them have three minor legs. S&P500, 1H .png) Oct 16 2017; USDNOK Can Resume Downtrend
USDNOK made only three waves up from September low, seen as a corrective wave 4) so we expect downtrend to resume, especially once channel support line is broken. .png) Oct 17 2017; EURCHF Trading Bullish EURCHF is trading bullish since February of 2017; now looking again up from red wave 4) into wave 5). EURCHF, Daily .png) Oct 23 2017; GBPAUD Remains Bullish Five waves up and three waves down is a clear bullish pattern that is visible on GBPAUD, so price can gain back to 1.7180 in days ahead. GBPAUD, 4h .png)
Previous Next Oct 31 2017; NZDJPY Is Out Of A Bullish Channel NZDJPY is making an important breakdown, out of an upward channel which indicates on more weakness in play, down to 75.65 while 80.94 is in place. Intraday rallies may be interesting to join the bearish ride. NZDJPY, Weekly 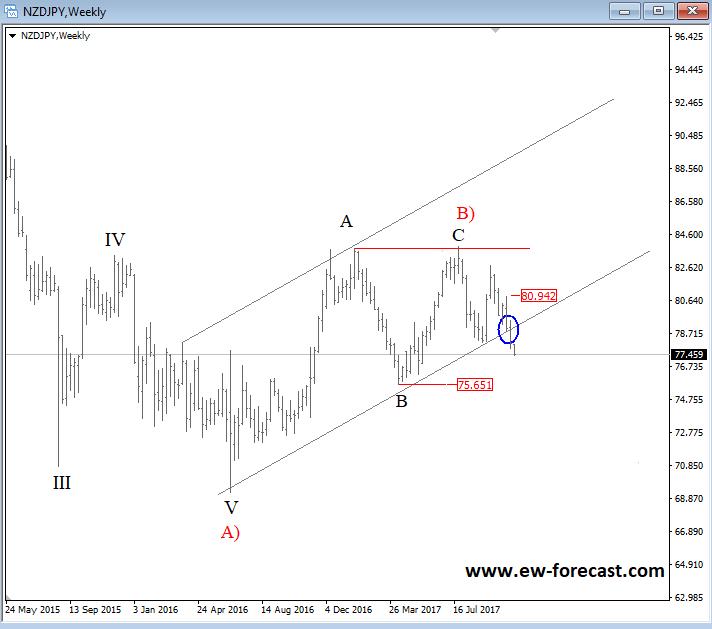 Nov 10 2017; NZDUSD NZDUSD is trading lower since July which can be a new downtrend in progress confirmed by a broken channel on a weekly scale. Also, we see that same channel line as a resistance around important psychological level here at 0.7000/0.7050, ideally limited upside for a wave four based on 4h count. NZDUSD, Weekly and 4h .png) Previous Next Nov 13 2017; DAX Is Turning South DAX made five waves down, which means that top has most-likely been put in place and that more weakness will follow after an A-B-C pullback. Dax, 1h .png) Previous Next Nov 15 2017; Triangle On Silver Silver is showing a triangle formation, it's a continuation pattern that can cause a strong push down if we get a daily close price below wave d swing at 16.56. Silver, 4h .png) Previous Next Nov 22 2017; Bearish Reversal on DAX German Dax fell sharply lower, in five waves from 12537 to 12848 and is now making a three wave recovery into nice looking 13220-13250 technical resistance. It's a pattern that can cause a strong fall in sessions ahead. German DAX, 1H .png) Previous Next Dec 04 2017; Intraday Video- AUDJPY, NIKKEI, OIL, USDCAD Will AUDJPY continue lower if NIKKEI falls, will USDCAD bounce if OIL turns south? Previous Next Jan 10 2018; E-mini S&P500 E-mini S&P500 moved into some interesting Fib. levels here on 4h chart from where we may see a retracement into a fourth wave. Corrections are healthy and definitely waiting on it before we may play to the long side. 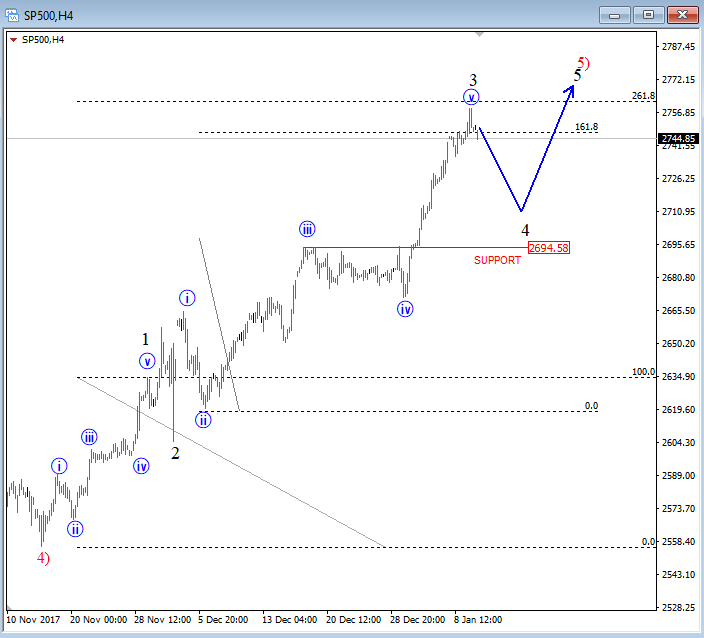 Previous Next Jan 12 2018; DAX Can Hit 13k On Pullback After reviewing the DAX analysis based on latest price structure I think there is room for even more weakness, towards 13000, and not only 13150/60 that has been hit yesterday that I covered on twitter. GH .png)
Previous Next Feb 08 2018; GBPJPY: Wedge Suggests More Weakness GBPJPY is at interesting junctures ahead of BoE today; Ending diagonal on 4h and five wave decline on 1h chart suggests more downside ahead. GBPJPY 4H and 1H .png) Previous Next Feb 13 2018; Intraday Bullish Path on E-mini S&P500 E-mini S&P500 is epxected to look for more upside as recovery from 2532 appears to be in five waves. Support is at 2621 and then at 2590/2600. .png) Previous Next Mar 16 2018; Bullish Reversal on BUND Bund made a nice five wave of recovery from latest lows, which can indicate a change in trend from bearish to bullish. However nothing moves in straight lines, so be aware of a temporary three-wave pullback to around 157.00/156.00 zone. German BUND, Daily 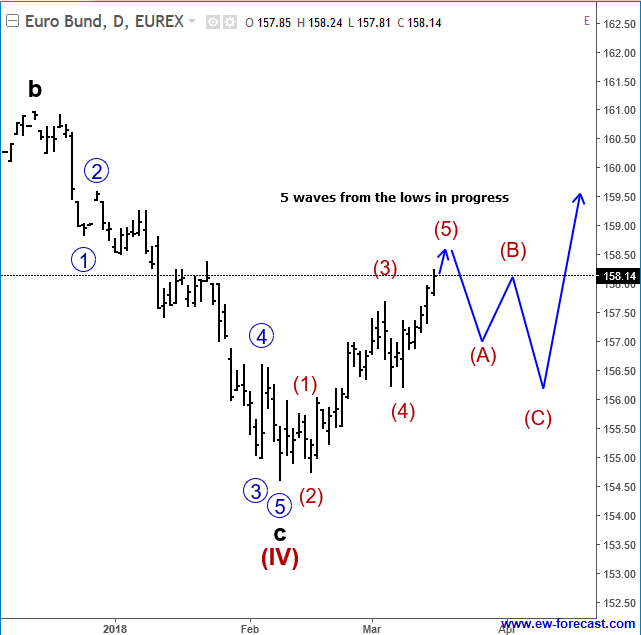 Previous Next Mar 22 2018; EURGBP Within a Bearish Move Lower time frames on EURGBP are quite clear and give us a clear direction, where the trend should proceed. If that is the case, then current five-wave fall from 0.8966 level may suggest more weakness, but after its contra-trend correction fully shows up. Resistance for this probable correction can be around the 0.8799 level. EURGBP, 4H 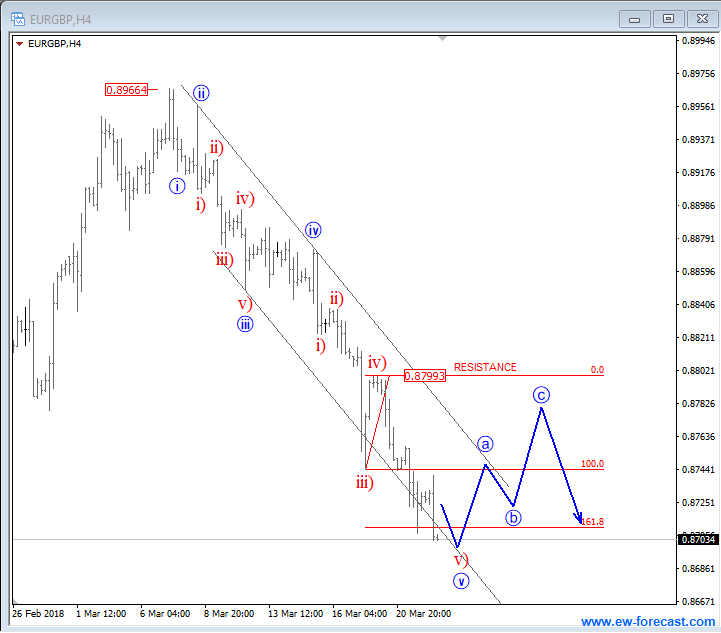 Previous Next Apr 09 2018; Housing Starts Can Impact Stocks In current free chart section we are going to look at how housing starts can have an impact on the stock markets. For more details check the chart below. 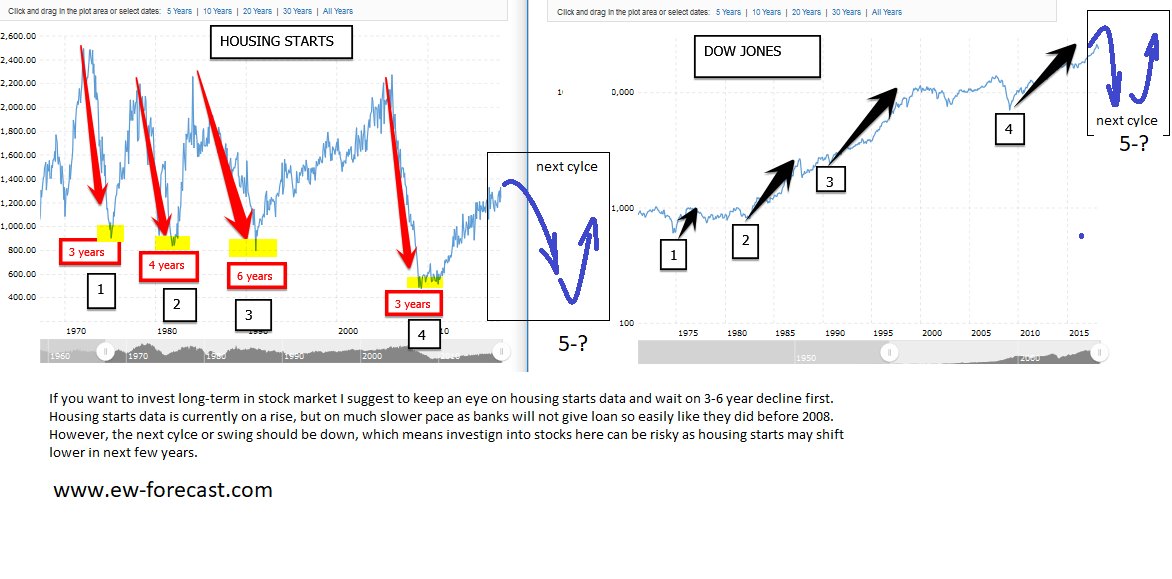 Previous Next Apr 17 2018; 10 Year Note Up, Stocks Lower? If 10 year US note is in wave (B) then we can expect a break higher for more recovery within wave IV which means that stocks can come under-pressure. 10 year US notes vs S&P500, 2h .png) Apr 25 2018; AUDUSD Looking Bearish Long-term Major trendline on AUDUSD can push prices lower, towards 0.60. AUDUSD, Monthly .png) Previous Next May 09 2018; Bears Taking Over GBPUSD A five-wave movement in Elliott wave theory indicates a change in trend; in our case this is from bullish to bearish. GBPUSD, 4h .png) Previous Next May 10 2018; Bullish Development on DASH Five waves up and a three wave of retracement to around 400 area suggest that bulls may again sent price to the upside. DASH, 4h 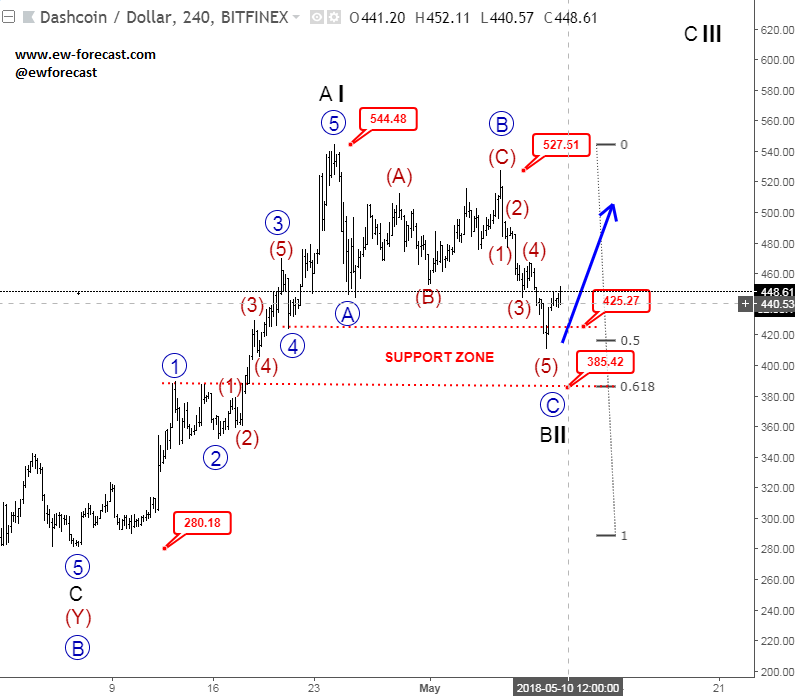 Previous Next May 14 2018; EURUSD At Resistance EURUSD is currently on a small rise, up from 1.1823 level. We believe it can be corrective wave 4, that can turn bearish around the 1.2031/1.2040 region, where Fibonacci ratio of 38.2 and the former swing high sit. EURUSD, 4h .png) Previous Next May 16 2018; GBPJPY Looking Lower A three wave rally from February lows to April highs suggests a drop towards 145.90/144.50 area. GBPJPY, Daily 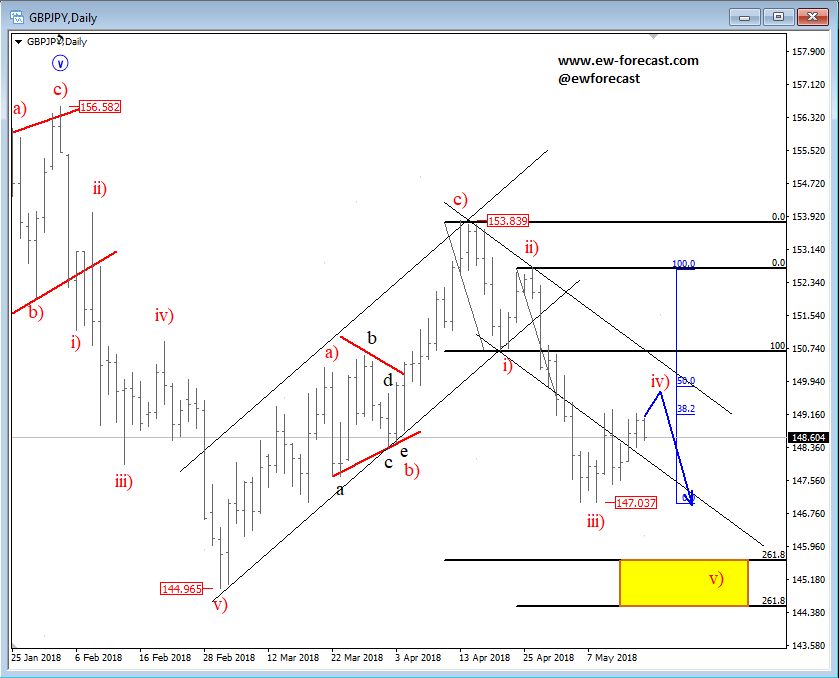 Previous Next May 21 2018; Gold At Support GOLD is approaching the lower trend line, connected from December 2016 lows. This trend line can react as a support, and can push prices higher. GOLD, Daily 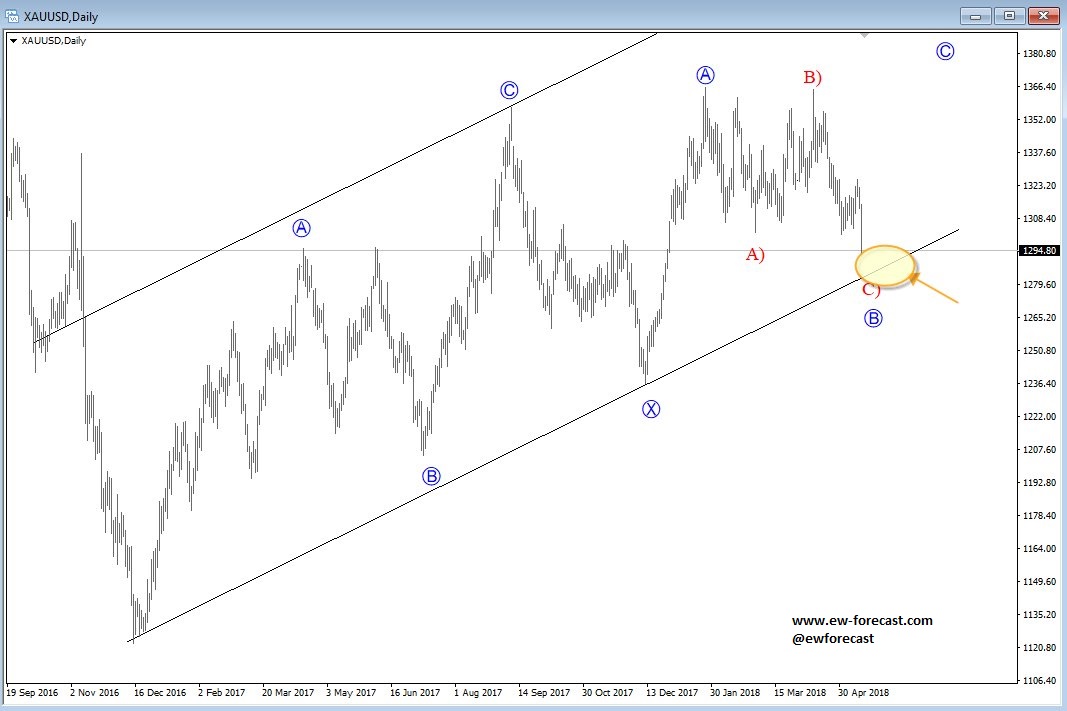 Previous Next May 24 2018; USDJPY Looking Lower A turn in impulsive fashion, and a firm break below the trend line connected from May lows can be first pieces of evidence for a top in place, and for a bearish reversal. USDJPY, 4h 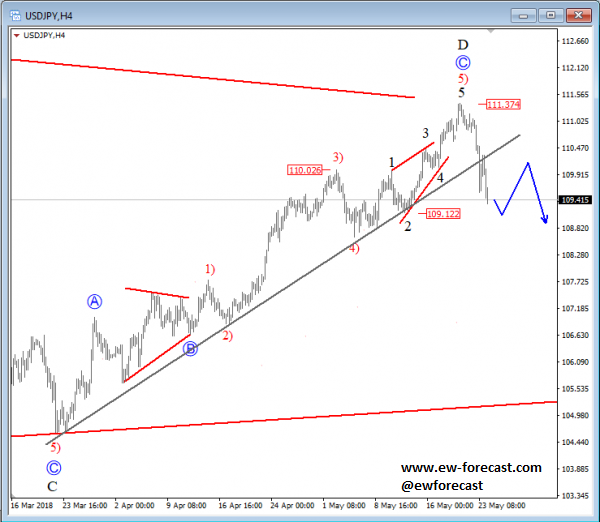 Previous Next May 28 2018; DAX Eyeing More Weakness Three-wave recovery on DAX can be corrective, meaning more weakness may follow below 12845 level. German DAX, 1h .png) Previous Next June 05 2018; 10 Year US Note At Support 10 year US note is at nice support around Fibonacci of 61.8% that can push price back to the upside. 10 Year US Notes, 2h .png) Previous Next June 11 2018; DAX-Keep An Eye On 13k Dax is currently trading higher, but with three legs only into 13k level which can be an important resistance for this week. Dax 1h .png) Previous Next Jun 12 2018; More Weakness On BTC Sharp fall through 7300 level on BTCUSD suggests that cryptocurrency is in impulsive decline which may cause more damage in the very near-term; towards to 6400-6500 after wave four. BTCUSD, 4h 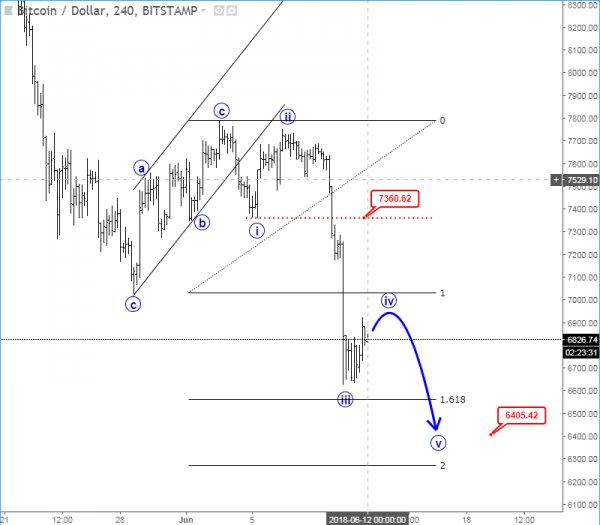 NEW!! Digital Currency service An advanced technical market analysis on BTCUSD, ETHUSD, LTCUSD, BCHUSD, XRPUSD plus some ALT coins Limited Offer: Two Months For Price Of One!! Previous Next June 14 2018; AUDUSD Is Looking Bearish AUDUSD is showing evidences of a complete three-wave correction from May lows; we see a drop in impulsive fashion and below the channel line connected from 0.7512, which points towards more weakness. AUDUSD, 4h 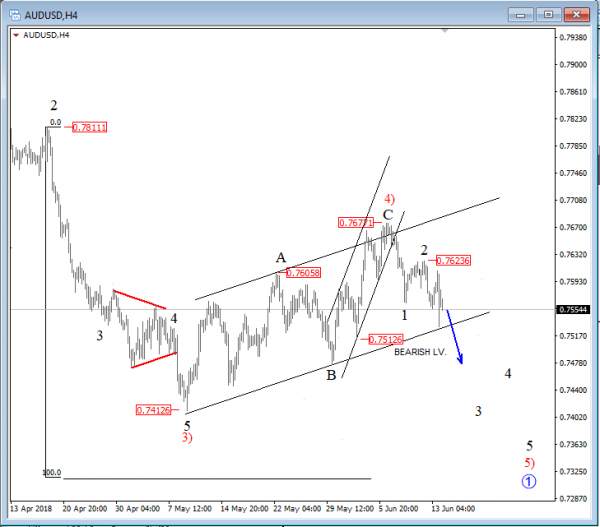 Previous Next June 21 2018; USDCAD Up and OIL Down Crude OIL made a break below the trendline connected from 2017 which is a suggestion that more weakness can be coming, ideally towards 60.10 area. At the same time we see USDCAD in negative correlation, with recent break above the upper trendline connected from 2016 highs which points to more gains. Crude oil, Daily 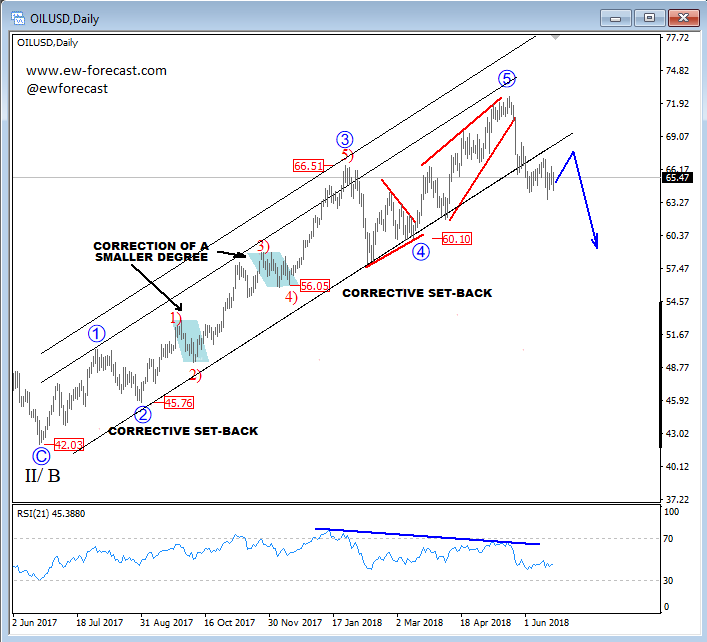 USDCAD, Weekly 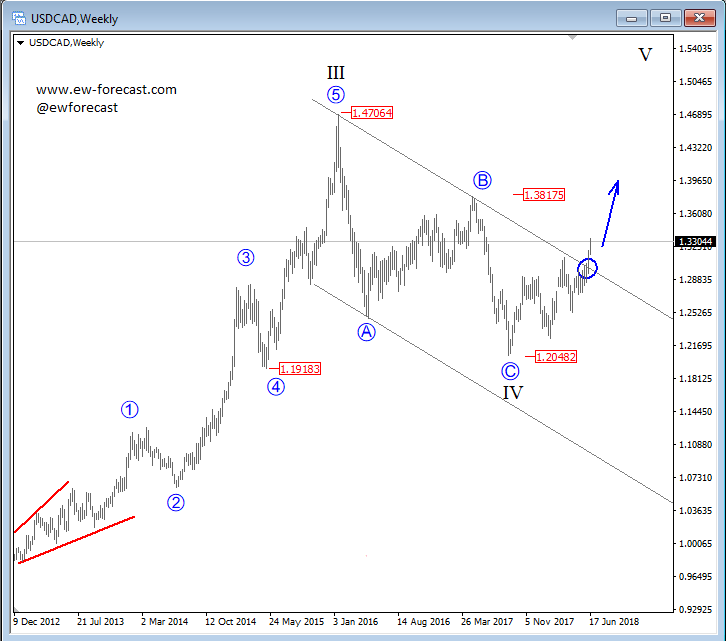
Previous Next June 29 2018; EURUSD At Important Support Recent ups and downs in the last two weeks, above 1.1500, suggest that this is a correction before the floor gets broken. EURUSD, Daily .png)
Previous Next July 04 2018; EURAUD vs E-mini S&P500 Are you trading cross pair EURAUD, but not paying attention to stocks? Well, based on price action since January we think there is important relationship. EURAUD vs sp 2h 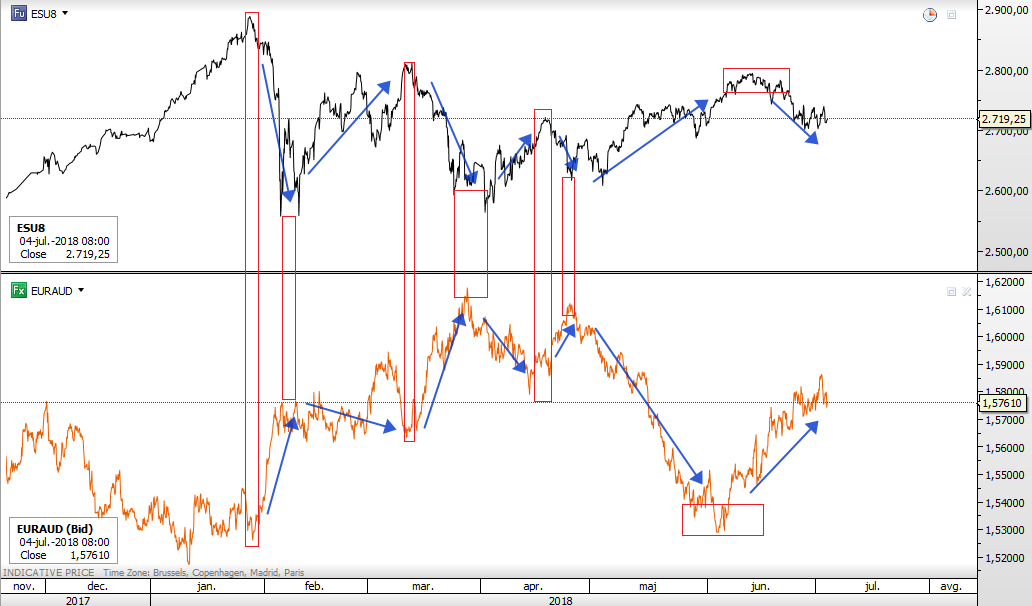
Previous Next July 04 2018; IOTBTC at Support Three waves down on IOTA suggest more upside; also price is at support and interesting Fibonacci ratio from where prices are already turning higher. Break above 0.00026 would confirm more gains. IOTBTC, Daily .png) NEW!! Digital Currency service An advanced technical market analysis on BTCUSD, ETHUSD, LTCUSD, BCHUSD, XRPUSD plus some ALT coins Limited Offer: Two Months For Price Of One!! Previous Next July 12 2018; EURUSD HS And Cycle Analysis H&S pattern and cycle analysis suggest a break below 1.1500 till end of the month.
Previous Next July 16 2018; BTCUSD Will Jan-Aug Correction Repeat? BTCUSD, Daily Log 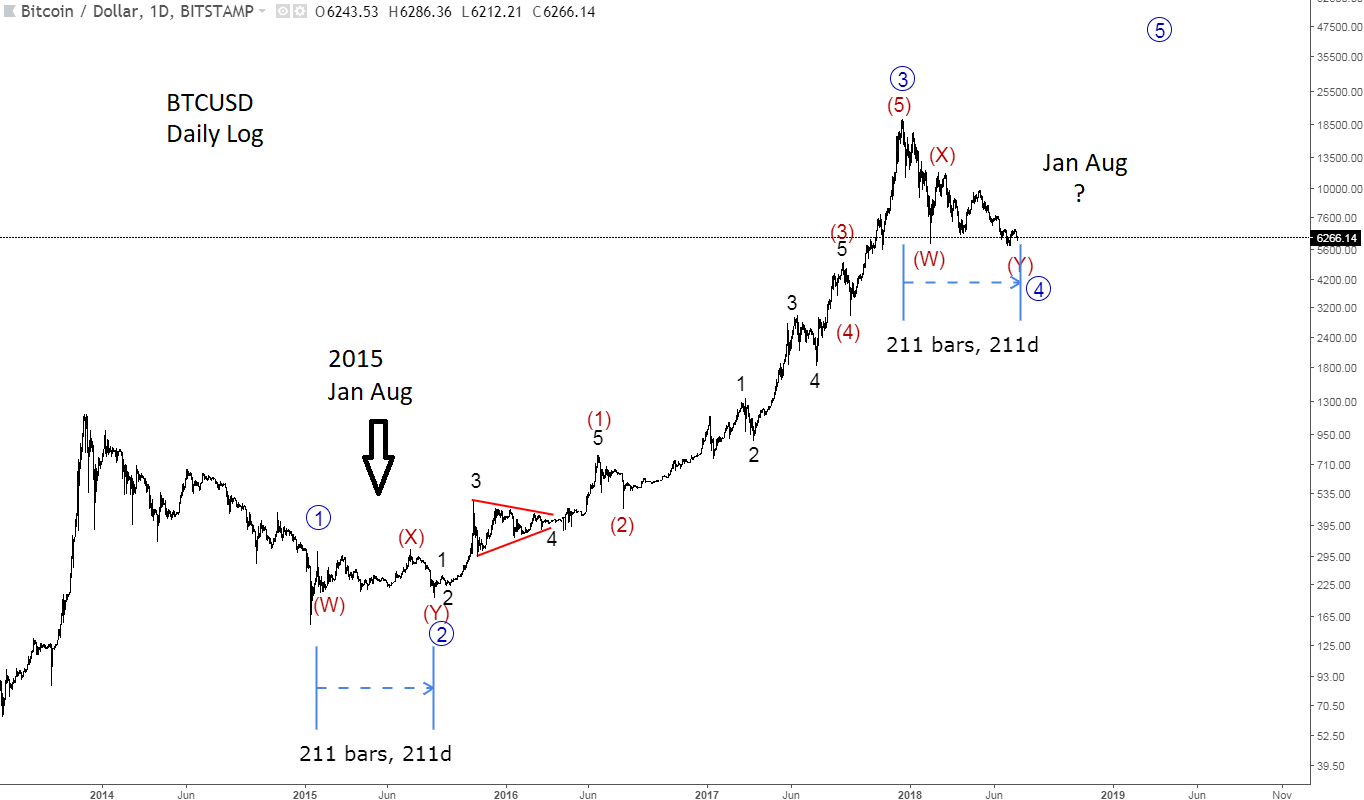 Previous Next July 25 2018; BTCUSD Recovering from the Lows Bitcoin can be unfolding five waves up away from 5751 lows, which would suggest a temporary bullish reversal. BTCUSD, Daily 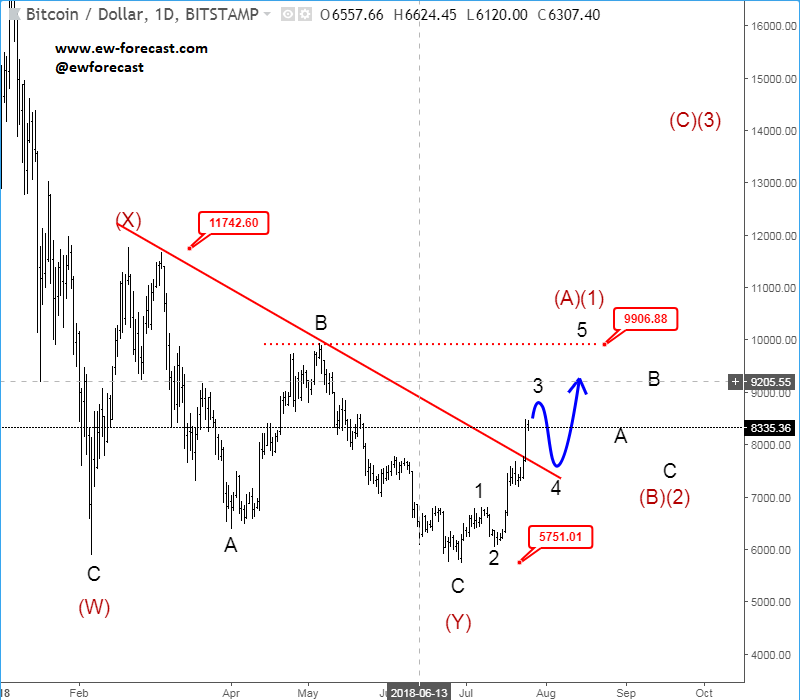 Previous Next July 31 2018; Correction on S&P500 Points Lower Five wave decline on s&p500 points into a three-wave temporary correction, that can look for a bearish reversal around the 2820-2830 area. More weakness in view. S&P500, 1h .png) Previous Next Aug 02 2018; ETHUSD Flashback Chart From a correction to an impulse on ETHUSD, since July to August. If everything goes as expected 360/335 area can be reached. ETHUSD Flashback chart 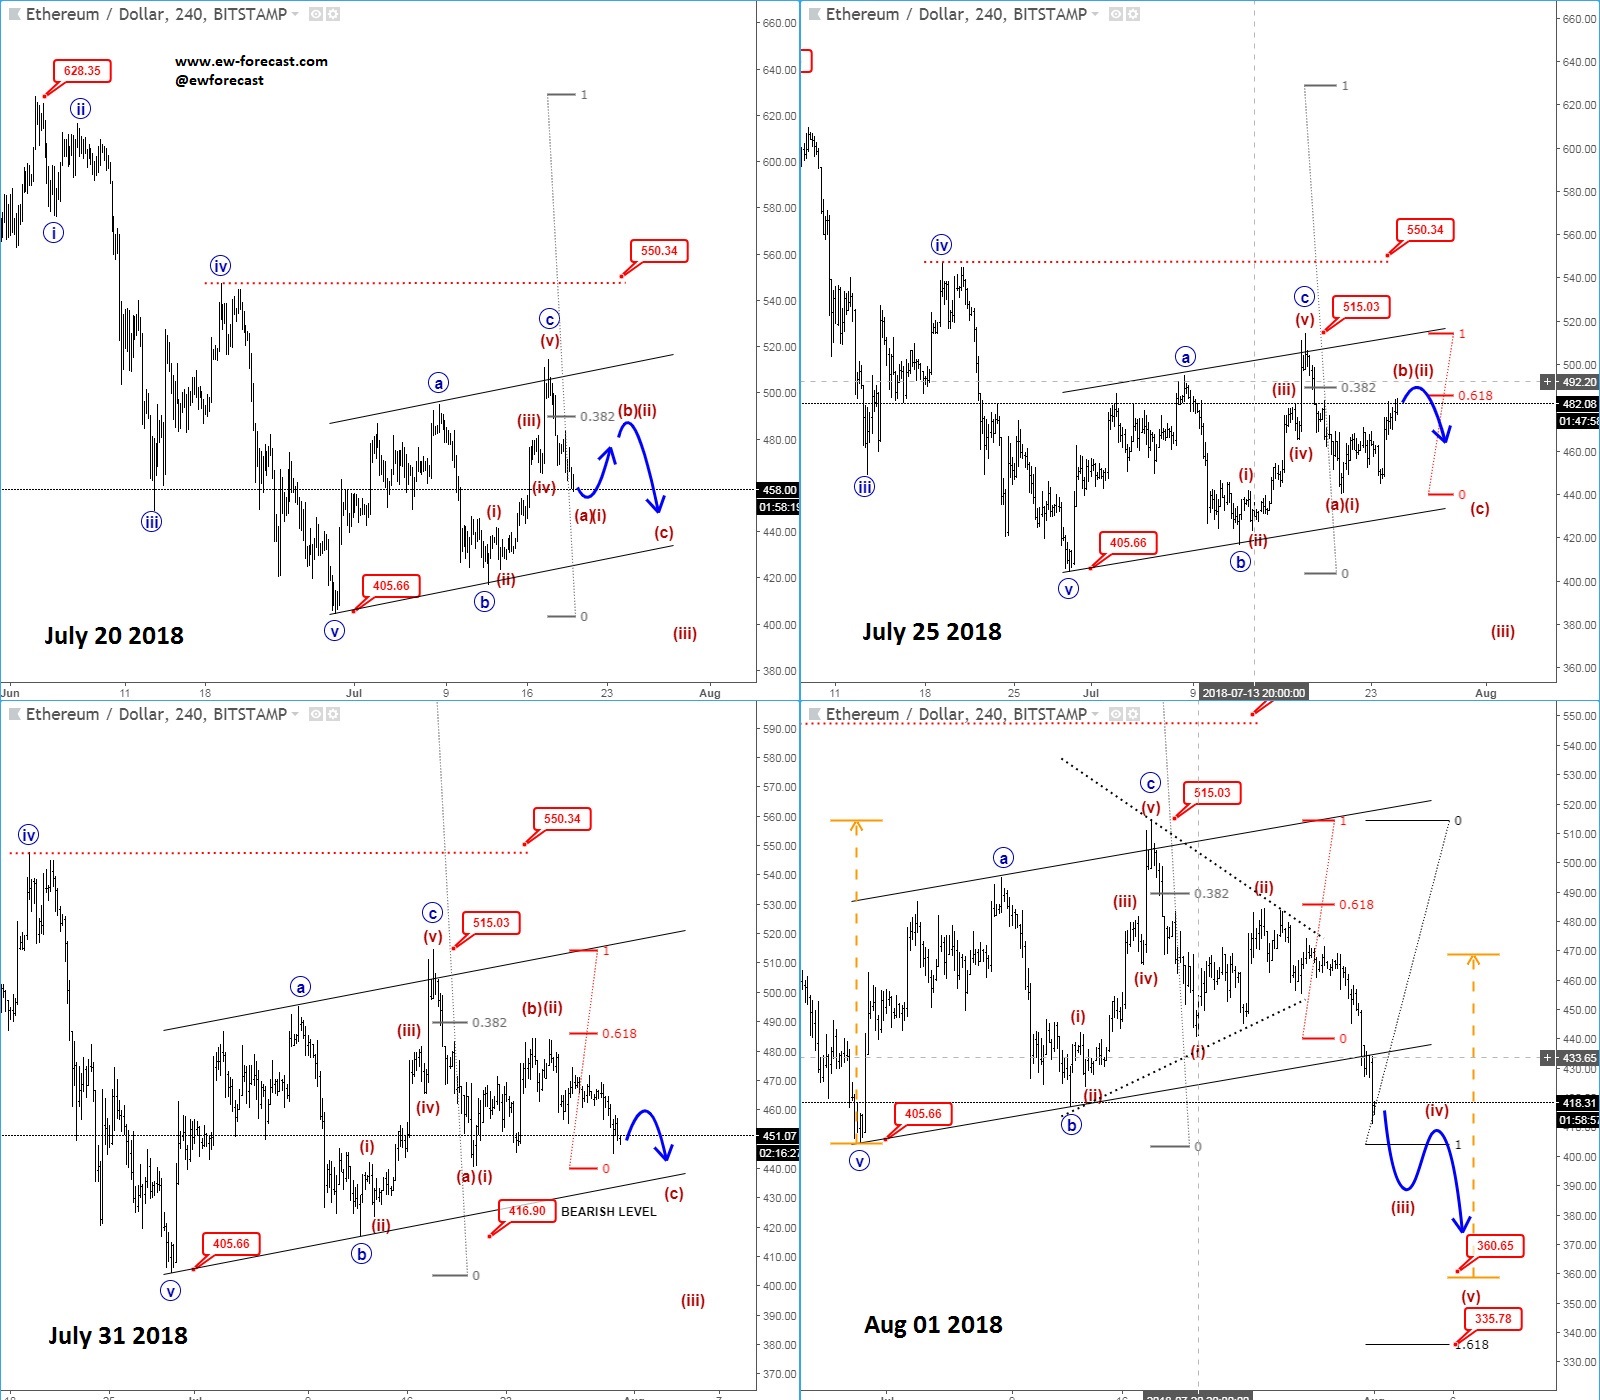 Previous Next Aug 14 2018; Bullish Bunds Bearish For Euro German bund remains in uptrend; making a five wave move higher which suggests more euro weakness. .png) Previous Next Aug 17 2018; AUDUSD Fell Out Of Triangle At the end of the volatile week like this is good thing to make a step back and go through level and formation on higher time frames. Here is AUDUSD. Played on the short side recently, but glad to be out now. GH .png) Previous Next Aug 31 2018; BTCUSD Video Analysis Crypto currencies are still in downtrend; but if ending diagonal will prove to be correct on BTCUSD, then this market can still be very interesting later this year GH
Previous Next Sep 07 2018; BTCUSD FlashBack Clear and simple, step by step EW process. .png) Previous Next Sep 17 2018; EURUSD Bearish H&S Pattern Bearish H&S pattern on EURUSD can cause a strong drop later this year, but firstly we have to see a complete right shoulder which can be headed to 1.19/1.2 levels first. EURUSD, Weekly 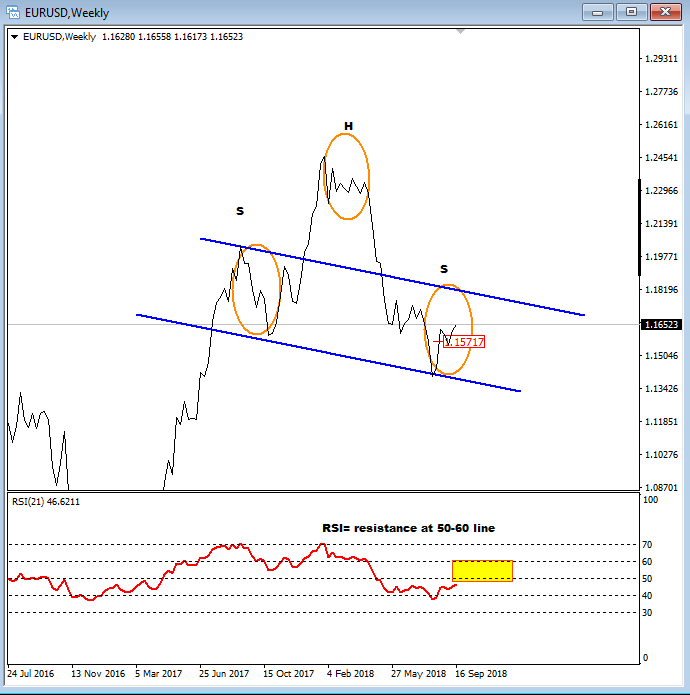 Previous Next Sep 20 2018; Three-wave Rally on GBPJPY Can Be Ending An unfinished five-wave development in wave C can end near the 149.0/149.30 area.
GBPJPY, 4h 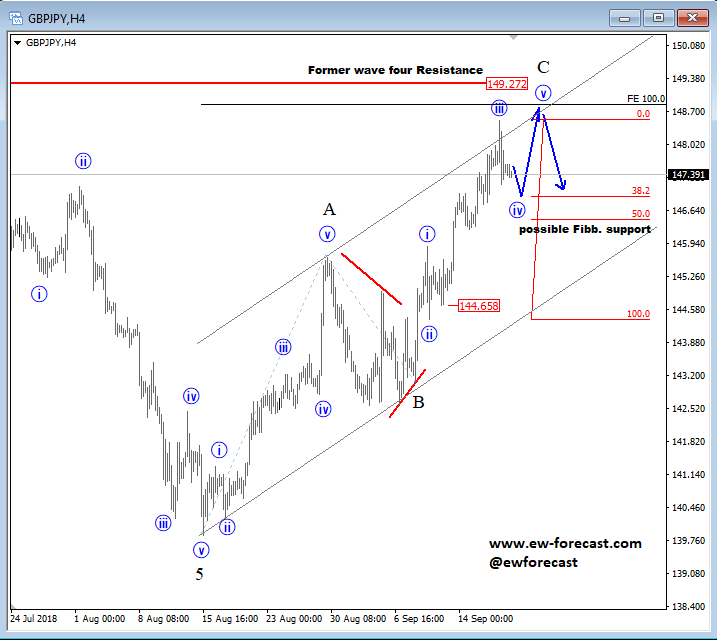 Previous Next Sep 27 2018; Has Ripple Found A Base? A completed three-wave correction on Ripple can suggest more upside. Ripple, 2h 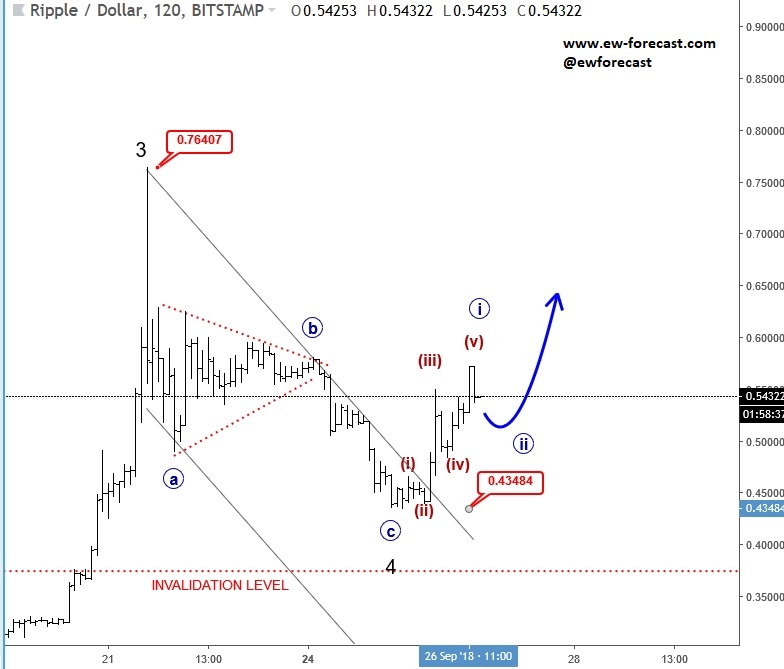 Previous Next Oct 01 2018; Can Crude Oil Hit 80USD? H&S projected target, and daily+weekly Fib. levels show room for $80 on Crude Oil. Crude oil, Weekly + Daily chart .png) Previous Next Oct 01 2018; BTCUSD Volatility Index We are tracking BTC Volatility Index, where we can see diagonal in progress, so we may see higher volatility soon, similar as it happened at the beginning of Septembe. S once volatility index turns up, we may see BTCUSD falling sharply once again if we consider that current recovery is on slow pace. 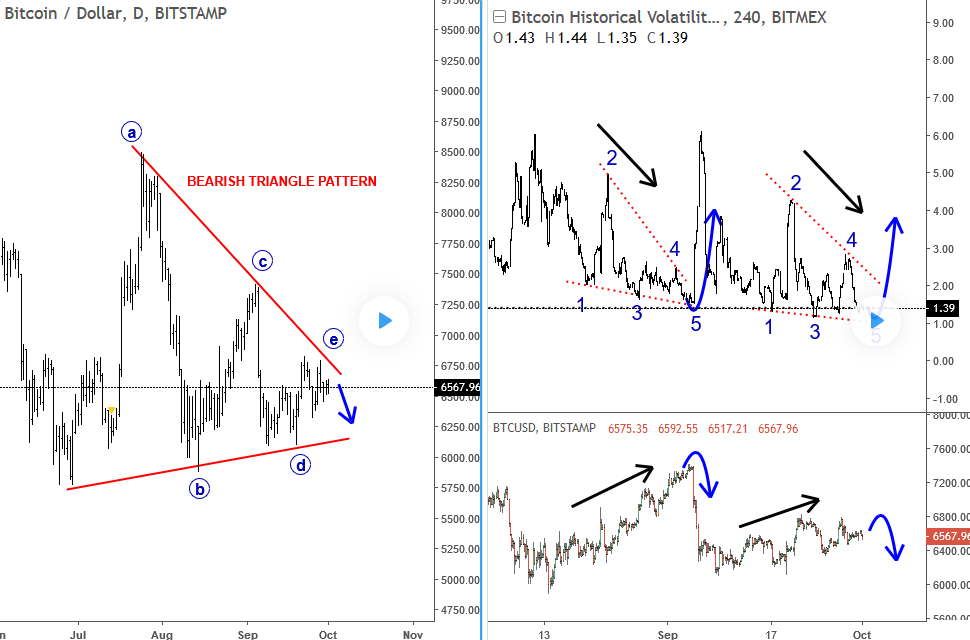 Previous Next Oct 04 2018; Five Down On 10 Year US Notes 10 year US notes can be looking to complete five wave cycle from September highs. 10 Year US Notes, Daily .png) Previous Next Oct 08 2018; Is USDJPY Ready To Turn Bearish? Bearish weekly candlestick formation on USDJPY and five down on 10 year US note may suggest a reversal in upcoming week. Ideally USDJPY will see lower prices while 10 year US note finds a support. 10 Year US Notes and USDJPY 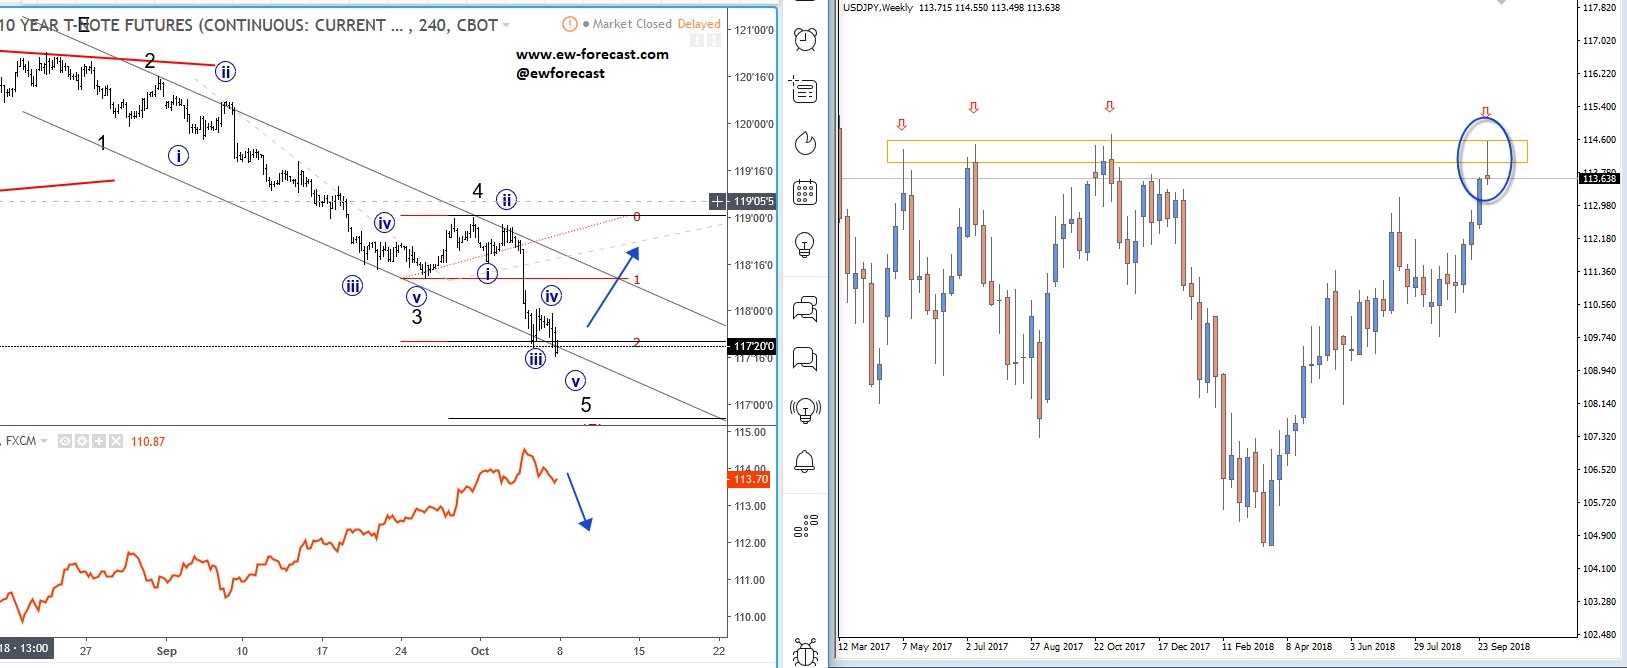 Previous Next Oct 12 2018; Triangle on Monero Points Lower Monero has recently completed a bigger triangle, a continuation pattern which now already points towards new lows. We expect to see a five-wave decline in the next few days or weeks. Monero, 4h .png) Previous Next Oct 22 2018; Risk-off May Continue More weakness on stocks may cause another leg down on XXX/JPY pairs. I am closesly wathcing AUDJPY and USDJPY. GH Intra-day correlations chart .png) Previous Next Oct 26 2018; Silver Moving Into Resistance Anyone that is bullish on silver, may want to consider the following chart. I think that bullish price action can be limited as I see price testing a triangle trendline from the outside, while recovery on intraday has personality of a correction. Important resistance levels are at 15.00 followed by 15.50. GH Silver, Weekly + 4h 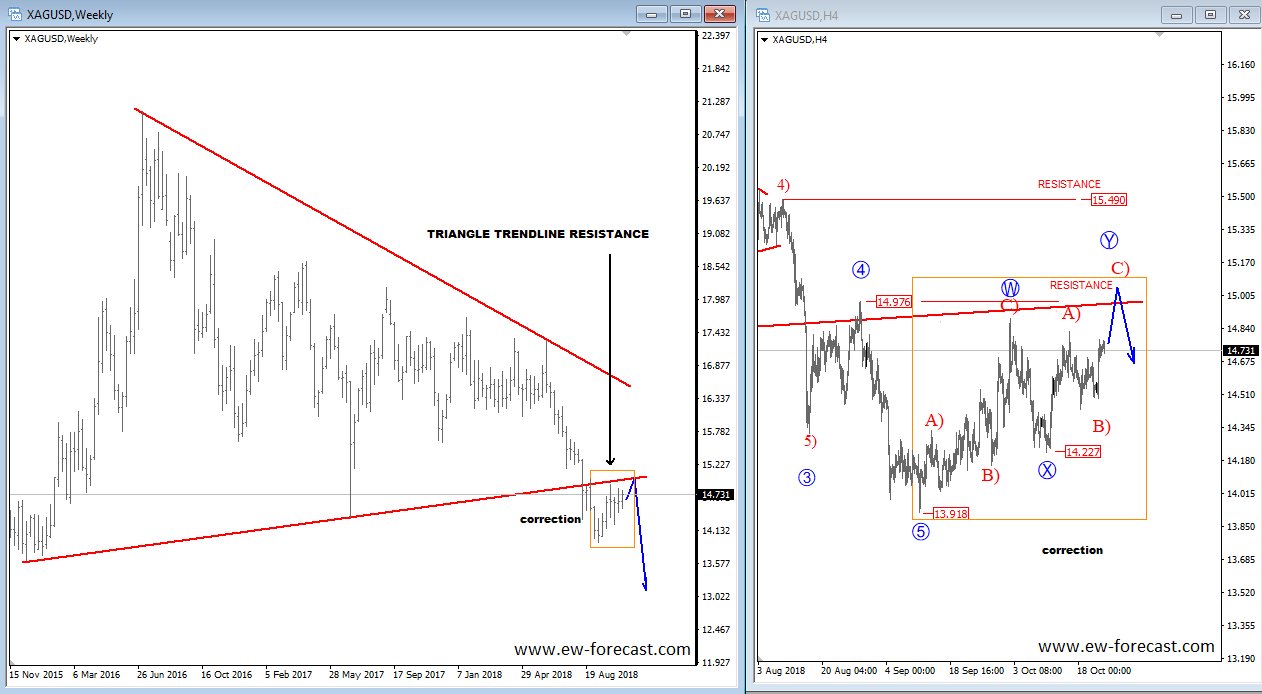 Previous Next Oct 29 2018; Gold Hits Important Resistance A three-wave recovery on Gold can slow down at important 1235/1250 resistance area. GOLD, Daily 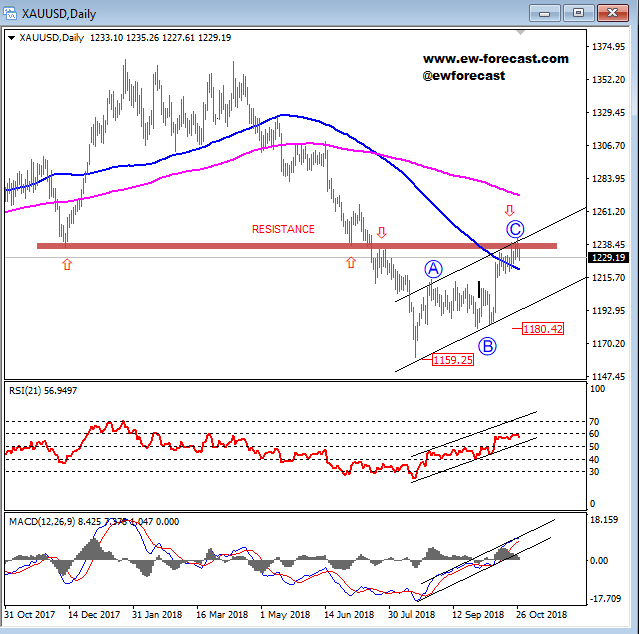 Previous Next Nov 05 2018; Dax Can Fall To 11200/11250 DAX can see more weakness, at least short-term towards 11200/50 after recent turn down below the wedge trendline and possible H/S pattern. 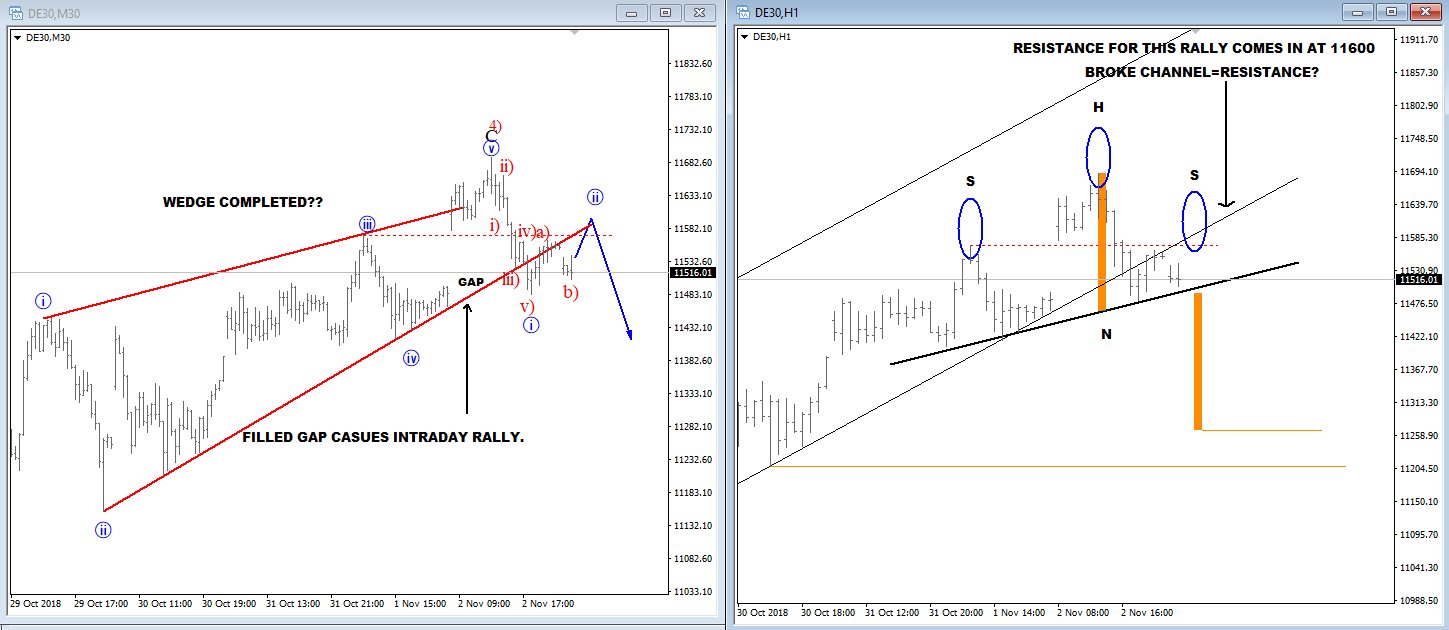 Previous Next Nov 12 2018; BCHBTC Flashback As expected, we have seen a nice bearish reversal from projected resistance area (0.1000) on Bitcoin Cash (BCHBTC). More weakness in view towards new lows! BCHBTC, Daily (before chart) 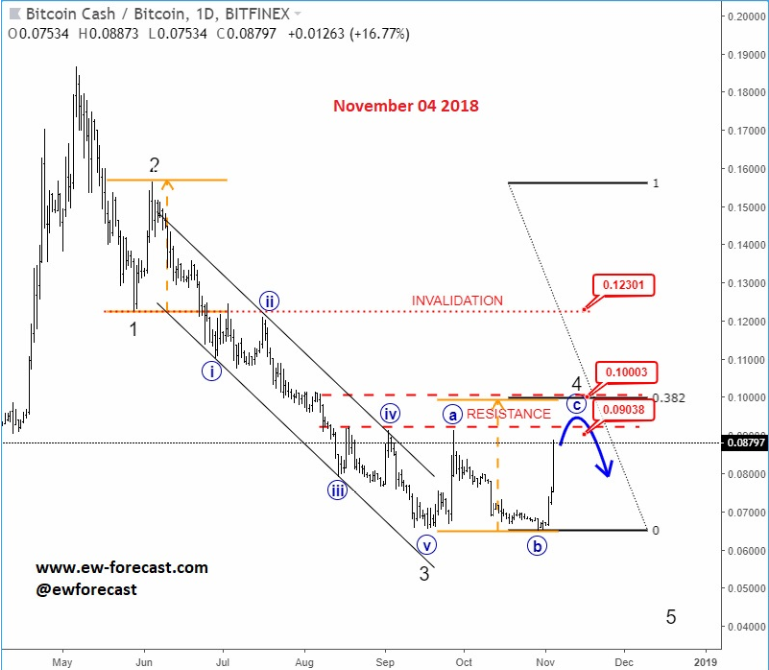 BCHBTC, Daily (after chart) 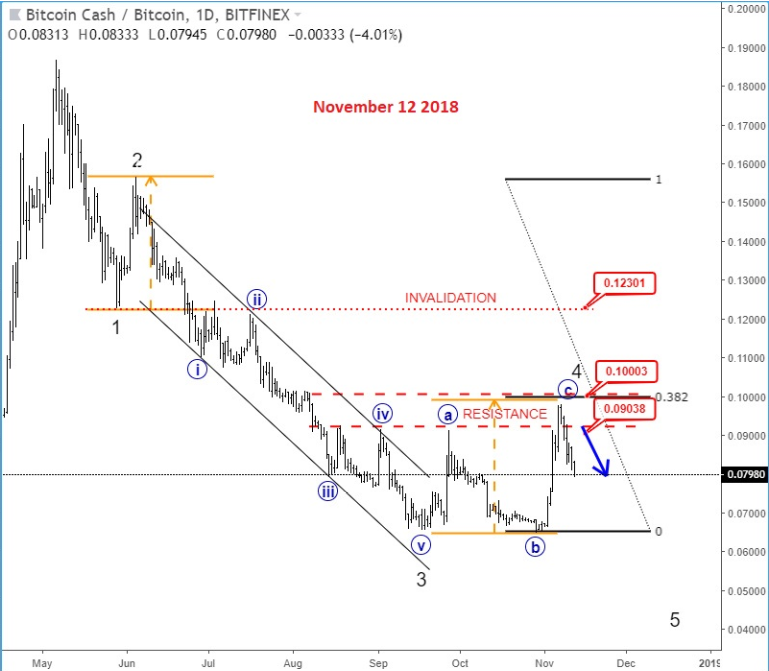 Previous Next Nov 14 2018; FLASHBACK: Vertcoin Trading As Expected Vertcoin against the dollar is trading exactly as expected. We can see that price was still unfolding a complex consolidation on October 23, however one week later new breach and weakness was seen, which continued towards the 0.5804 level. Now the question that remains is can we expect an even further bearish continuation? Vertcoin/USD Flashback charts .jpg) Previous Next Nov 15 2018; Bullish Gold and AUDUSD Gold bounced from a double trendline support which can cause more upside and potential lift Aussie to higher prices too. Gold and AUDUSD, 4h and 1h charts .png) Previous Next Nov 21 2018; Crude Oil Ready TO Bounce? 30min chart of crude oil shows five waves of recovery, that can be an important bullish reversal that may drive prices even higher after a-b-c set-back. That five waves up also occurred from the EW channel support line shown on 4h chart. CRUDE OIL, 4h and 30min charts .png) Previous Next Dec 12 2018; Triangle Suggests Weaker Oil Prices Crude oil is trading bearish since start of October, however stopping for a temporary triangle in wave 4. Be aware of more weakness, below 49.36 level, once this correction fully develops. Crude oil, 4h .png) Previous Next Jan 07 2019; NZDUSD Is Recovering NZDUSD is slowly and steadily recovering from the 0.658 area; ideally a new five-wave rally is in progress, which can aim beyond the 0.697 level. NZDUSD, 4h 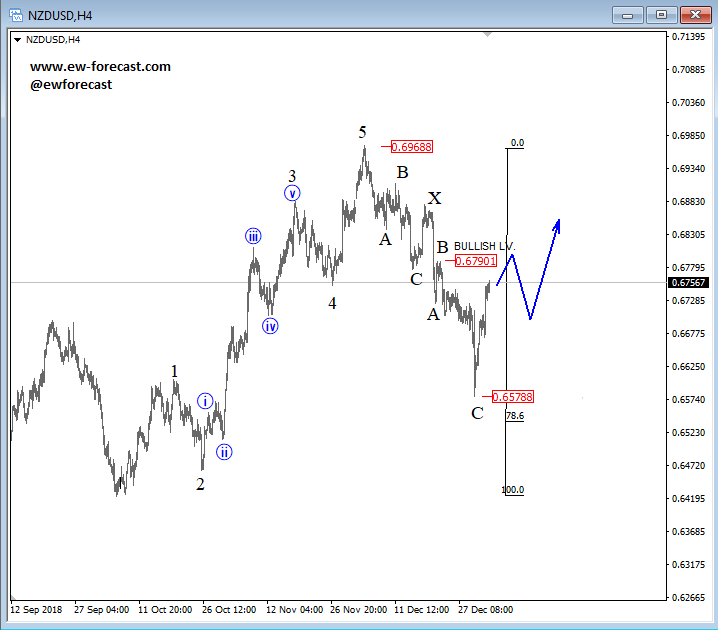 Previous Next Jan 09 2019; EURCAD Watch Out For A Rally Euro crosses are bearish, but short-term picture suggests that some pairs may see a corrective rally. EURCAD may see an A-B-C move higher if trendline is broken. In such case new ideal resistances for a downtrend to continue is around 1.5300. EURCAD, 1h .png) Previous Next Jan 16 2019; Bears Taking Over EURUSD EURUSD is nicely trading lower, now breaking below the 1.142 bearish level which indicates a minimum three-wave drop in play. That said, be aware of temporary corrections. EURUSD, 4h 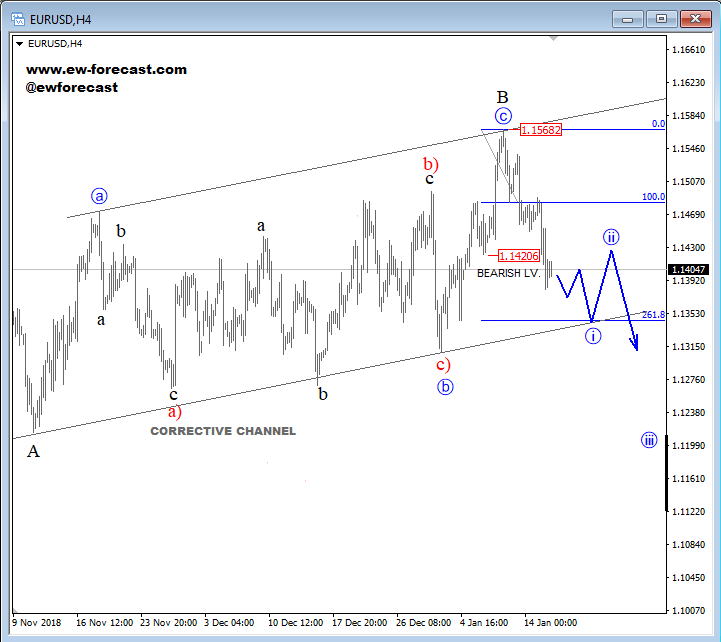 Previous Next Jan 18 2019; FLASHBACK: German DAX Trading As Expected German DAX traded perfectly out of an ending diagonal, which was located in wave 5) in December. We can now see a nice five-wave rally in motion, which can be part of a bigger, bullish cycle and can touch area near the 11300. German DAX, 4h Flashback charts 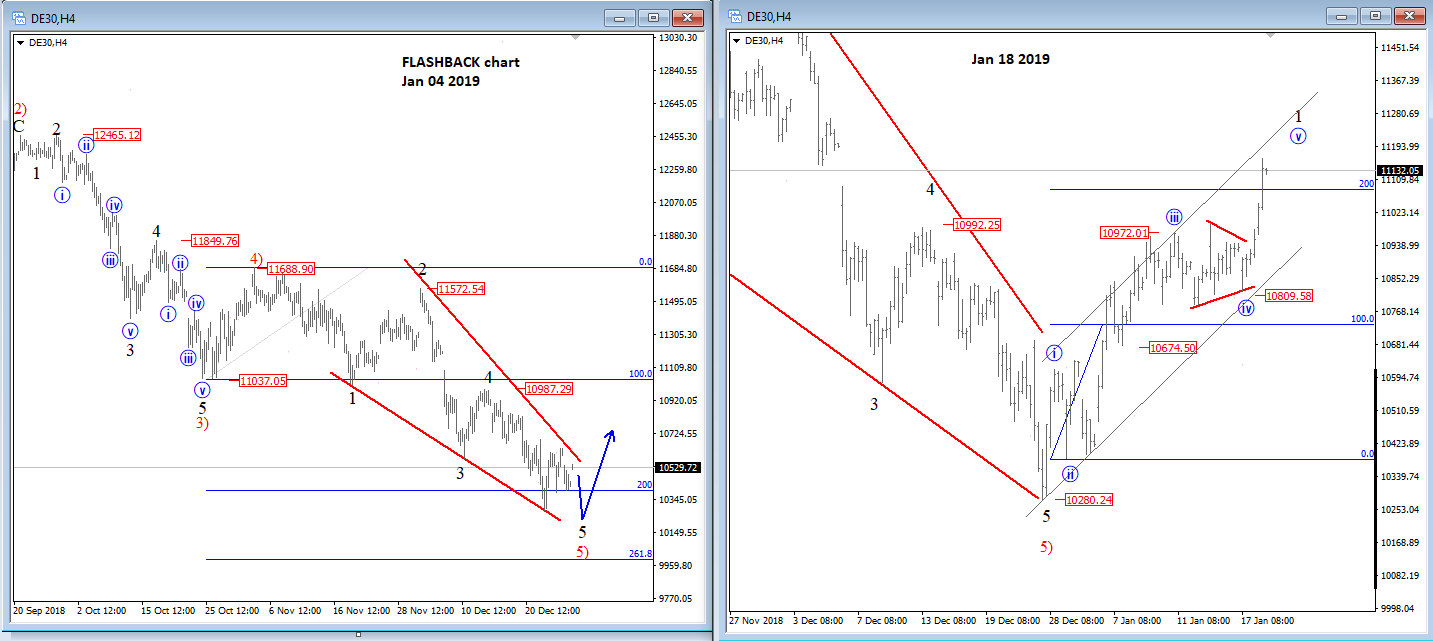 Previous Next Feb 04 2019; AUDUSD vs USDCNH Is USDCNH completing a corrective setback? Well, if US dollar will rise above 6.85 against CNH, then be aware of limited upside on GOLD and AUDUSD this month. .png) Previous Next Feb 08 2019; USDMXN Suggests A New Leg Down Feb 13 2019-update USDMXN is higher so triangle that we were tracking was placed in wave b rather than four. But its still a corrective bounce, so resistance may not be far away for this a-b-c move. Reversal can be coming for a fifth wave down; ideally from around 19.42. .png) Feb 08 2019 USDMXN has some interesting development; showing triangle in fourth wave so be aware of a new push lower. USDMXN, 4h .png) Previous Next Feb 18 2019; Lumen Can Be Finishing A Big Correction Within Uptrend Lumen (XLMUSD) may have a completed big three-wave (A)-(B)-(C) corrective decline in 2018, which is clearly visible in the logarithmic scale chart, especially since we have noticed a strong resistance from 2017 that can act as a strong support in 2019! That said, be aware of a bullish reversal, especially now when the Crypto market is turning bullish. .png) Previous Next Feb 19 2019; BTCUSD FlashBack Patience paid off; BTCUSD made a nice turn up, out of the wedge.
Were you looking for the same? Check our services and stay on track. .jpg) Previous Next Feb 26 2019; 10 year US notes vs SP500 If triangle on a 10 year US notes suggests a continuation higher, then current resistance on SP500 at 2800 may not be broken so easily..
GH Previous Next March 12 2019; EURAUD Can Be Forming A Bearish Setup EURAUD turned nicely bearish with five waves away from projected resistance, so seems like it's bearish confirmed now. But, before a continuation lower we may see a three-wave corrective recovery, where 1.6000 area can be retested and may act as a strong resistance. Anyhow, we remain bearish as long as it's trading beneath 1.6120 invalidation area.
EURAUD, 1h .png) Previous Next March 26 2019; GBPUSD Looking For A Top? Cable is on the rise, but move is slow and overlapping. I think it can be an ending diagonal, so be aware of a top at 1.34-1.35 area.
GH .png) Previous Next April 04 2019; BTCUSD Flashback Charts Hi traders,
BTCUSD is trading as expected since December of last year. We see a bottom at the 3102 level, which is now being followed by a temporary, three-wave reversal. BTCUSD Flashback charts, Daily .jpg) Previous Next April 27 2019; BTC Long/Short Ratio Hi traders,
Are you tracking BTC Long/Short ratio? I really think you should since it may tell you a lot about the next cycle for the bitocin price. Notice that BTC Longs / BTC Shorts ratio is at the lower side of a range so BTC Longs may step in soon and likely support bitcoin price even more, which is bullish already now! I posted some interesting video on this topic and highlighted potential rise of btc back to $6500. If you want to see the video make sure to check our promotion offer. Previous Next May 01 2019; Crude Oil In A Three Wave Drop Crude oil looks to have found a top at the 66.60 level for a bigger corrective retracement. As such latest sharp drop can be part of a three-wave reversal, that can take price below the 62.30 level, and towards the 60.0 region.
If for some reason price gets back above the 64.71 swing high, then corrective wave B)/2) is still in play. Crude oil, 4h .png) Previous Next May 02 2019; Recovery On Platinum Can Be Finished Three legs of recovery have completed wave 4; so be aware of more weakness after this recent reversal from the C=A level.
Platinum, Weekly (Before and After) .gif) Previous Next May 06 2019; Decline On USDCNH Does Not Look Finished First reactions to unexpected events are emotional and do not necessarily represent the "real" market flow. Everyone are calling $USDCNH to 7.00 after latest Trump twitts regarding the trade deal with China, but technicals say different.
USDCHN, Daily .png) Previous Next May 13 2019; BITCOIN FlashBack Our Weekly chart since December 17th of 2018 is doing exactly what we have been expecting last year. After a big three-wave (A)-(B)-(C) corrective decline in 2018, BTCUSD is finally turning back into a bullish mode. For more Digital currencies (ALT coins) sign up, NOW. BITCOIN, Weekly .png) Previous Next May 13 2019; CADJPY What is the most important when it come to trading and tracking markets is to keep an eye on search for clear patterns. The one below is very clear; three waves up and impulse turn below the trendline support, so there is a suggestion for more weakness ahead.
.png) Previous Next June 03 2019; NEW PAIR - USDTRY Hi traders! Below you can see how USDTRY played out in the last week or two. USDTRY, FLASHBACK Chart (1h) Click on the image to expand it. .jpg) NEW!! Finally, after a lot of requests the $USDTRY is included in our list of instrument for members. Register at www.ew-forecast.com/register Previous Next June 11 2019; Three Legs On S&P500 Point Higher As you know after a five-wave movement, three contra-trend waves will follow, and after they are completed the direction of the bigger trend may resume. So, is the SP500 headed back to all-time highs? S&P500, Daily 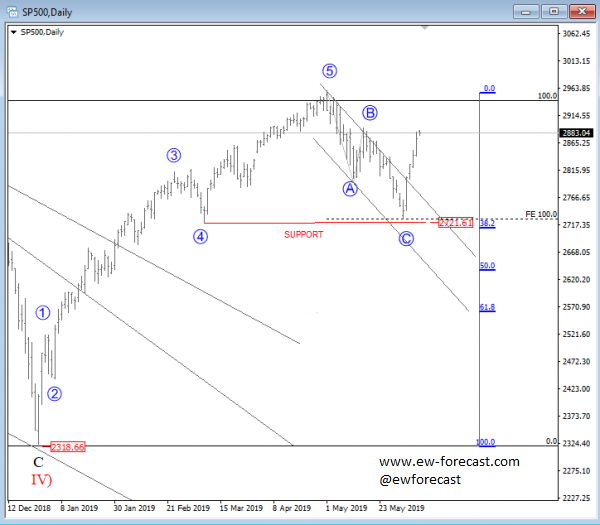 NEW!! Finally, after a lot of requests the $USDTRY is included in our list of instrument for members. Register at www.ew-forecast.com/register Previous Next June 13 2019; BTCUSD Futures Flashback Hi traders! Bitcoin futures is trading as expected since end of May, when we were expecting to find a temporary top and resistance for a wave 3. As we know prices dropped nicely since then, and can now be trading in a middle of a bigger correction. We see wave 4 in progress, with possible support around 7000/6000 region. Bitcoin Futures, 4h flashback charts .jpg) NEW!! Finally, after a lot of requests the $USDTRY is included in our list of instrument for members. Register at www.ew-forecast.com/register Previous Next July 12 2019; USDCNH Down, Aussie Up? Hi traders! PBoC says they will reduce real rates for small firms and all other steps to keep the yuan stable. Well, we see five waves down here on USDCNH so more weakness can come after an A-B-C bounce which at the same time can mean strong AUD. USDCNH vs AUDUSD, 4h .png) Previous Next July 16 2019; Gold Looking Higher Strong uptrend on gold suggests more upside, out of current wave IV consolidation. GOLD, Daily 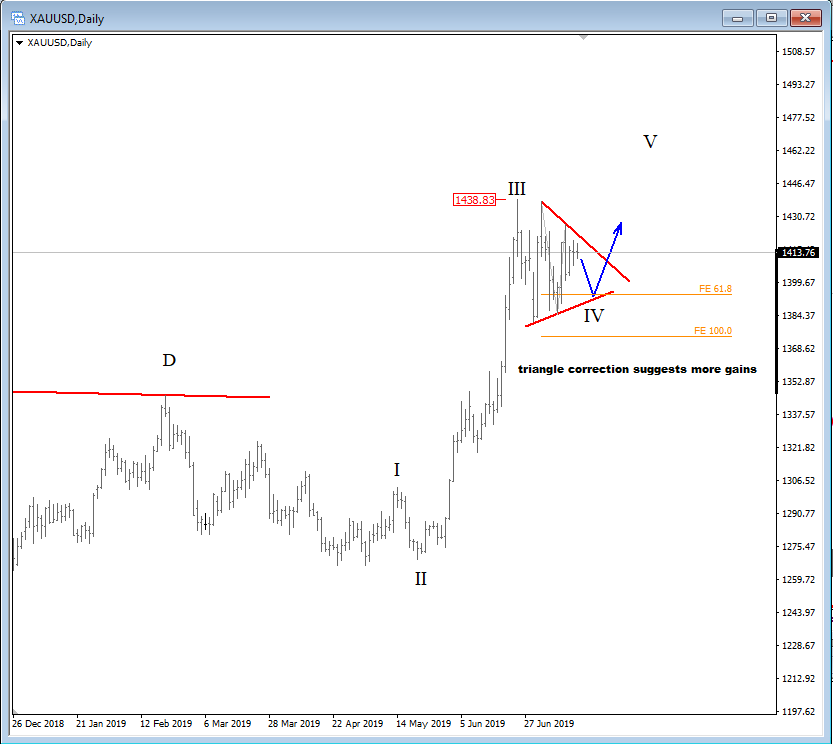 Previous Next July 23 2019; GBPNZD Sell The Rally Pound was one of the weakest currencies in the last few months, so if you are considering to join this trend then consider to wait a pullback. Nice resistance on GBPNZD is at 1.8700, it it gets there. GBPNZD, 4h .png) Previous Next August 19 2019; Bearish GBPUSD Stopping For A Pause On GBPUSD we see a bearish impulse in the making, that may see more weakness after a 290-350 pip rally to complete the fourth wave. GBPUSD, Daily 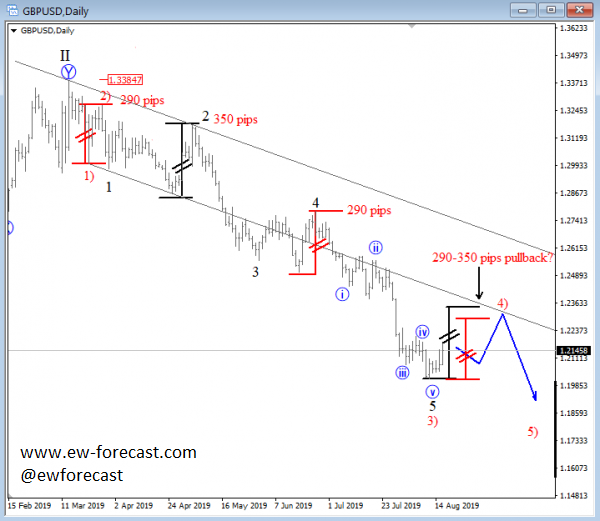 Previous Next August 23 2019; Bullish Triangles On Crypto We have noticed some bullish triangles in the Crypto market.. Is this a signal for a bigger recovery?! THETAUSD, 4h .png) MATICUSD, 4h 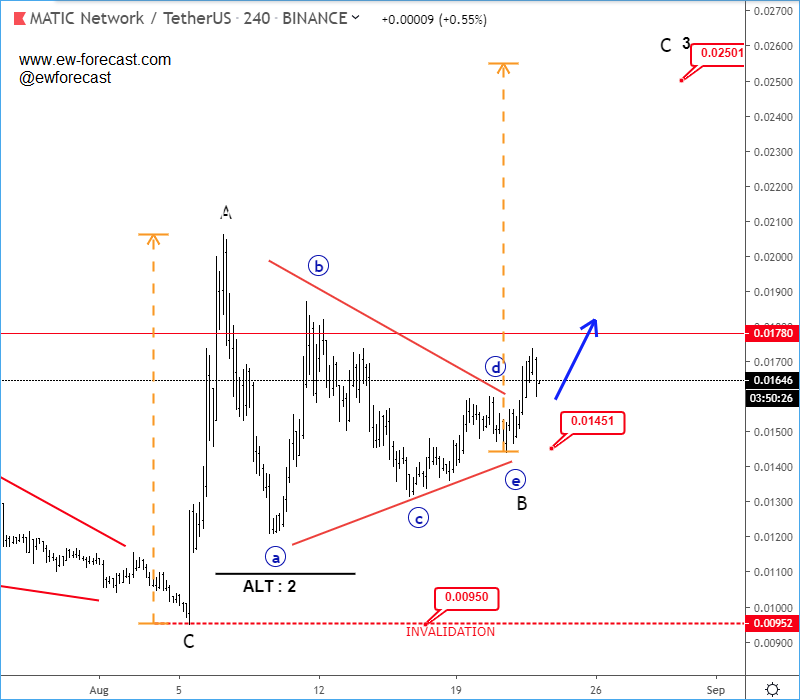 Previous Next Sep 17 2019; Natural Gas Can Be Bottoming Natural gas is bottoming after that very nice and strong turn up from the lows. It is a clear five wave move that will suggest more upside after a three wave set-back. Natural Gas, daily .png) Previous Next Sep 20 2019; EURGBP Breaks Key Support! – Elliott wave New Brexit hopes causes a break below 0.8894 important swing support; key level for further weakness into a bigger wave C. EURGBP, weekly + daily .png) Previous Next Sep 22 2019; Cable Can Climb Higher Within A Corrective Recovery GBPUSD can climb higher after the initial, minor, five legs within wave A), which suggest that the cycle since 1.338 is completed, and a move in minimum three legs is underway. GBPUSD, Daily 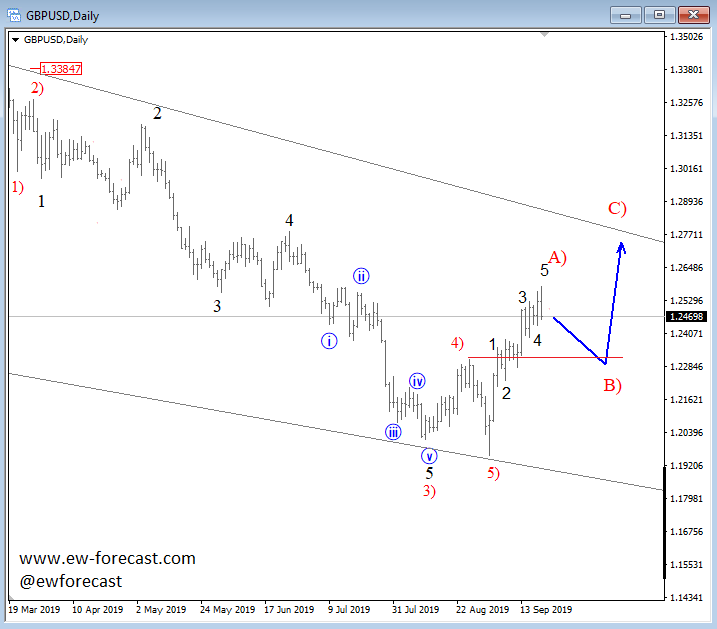 Previous Next Sep 27 2019; GOLD Turning From Resistance GOLD is dropping after an A-B-C corrective move, which seems to have found resistance and a bearish turn near the 1535 area. Current weakness is a suggestion of an upcoming five-wave cycle. GOLD, Daily 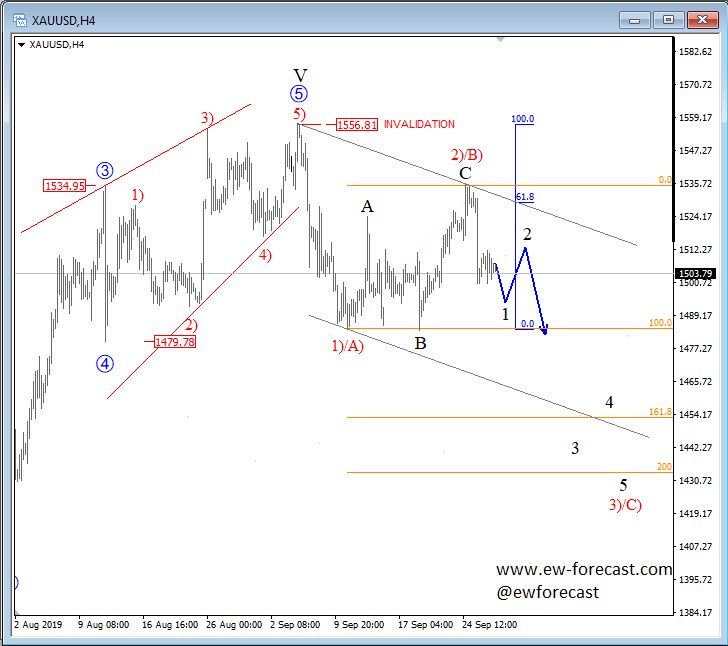 Previous Next Oct 15 2019; 10 Year US Notes Turning Down 10 year US notes are turning down after a completed three wave rise in B, so more weakness is likely coming which is bullish for the USDJPY. 10 Year US Notes vs USDJPY, 4h 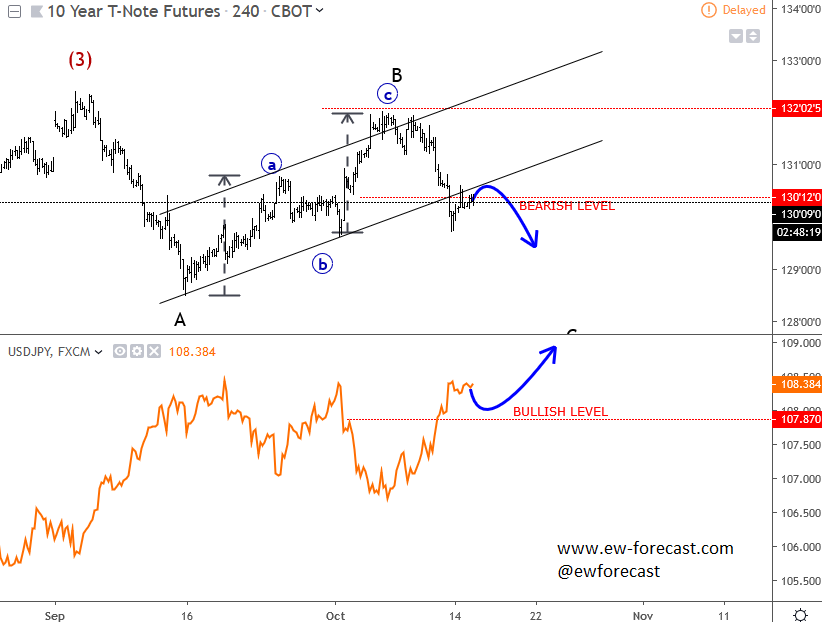 Previous Next Oct 22 2019; EURUSD- Intraday Correction Within Uptrend EURUSD is in a pullback mode, now seen in wave four which may reach the area of a former wave four around 1.1114 level, near 38.2% from where bulls may see another push up. .png) Previous Next Nov 07 2019; Bears Can Break 19.00 Level Minor correction from 19.01 low on USDMXN suggests further weakness targeting below 19.00. USDMXN, 4h .png) Previous Next Nov 12 2019; DAX: Final Leg Of A Monthly Cycle Different monthly counts on the german stock index suggest that final leg higher is here, so 2020/2021 may not be so optimistic. German DAX, Monthly .png) Previous Next Nov 21 2019; Correction on Crude Oil Points Lower Corrective recovery in seven swings on Crude oil suggests limited upside and a bearish turn. Crude oil, 4h .png) Previous Next Nov 26 2019; Correction On DAX Can Be Deeper Drop out of a channel can cause more damage on DAX. DAX, 4h .png) Previous Next Dec 02 2019; AUDJPY: Corrective Recovery At Resistance AUDJPY is now at potential resistance/bearish reversal zone here at 74.53/74.89 region; be aware of a turn lower. AUDJPY, 4h .png) Previous Next Dec 11 2019; December Can Be Important Month For BTC Can month of December once again cause an important swing for the Bitcoin? .png) Previous Next Dec 12 2019; Wedge on Silver Ending - Elliott wave Wedge can be ending on silver, ideally around 16.40 region. However we still want to see a break above the upper channel line to confirm further upside activity. Silver, 4h 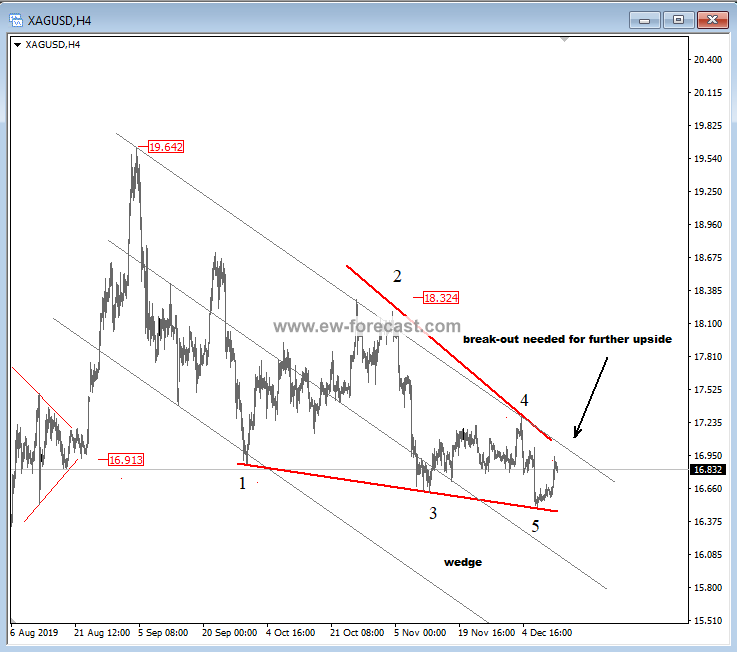 Previous Dec 19 2019; Bearish Developments On USDMXN USDMXN is in a bearish impulse, down from 19.658 area; currently we are tracking a minor correction as wave 4) within the downtrend. Possible resistance is near the 19.09/19.25 zone. USDMXN, 4h .png) |
New York time: 00:00:00
Local time: 00:00:00
| E-mail: | |
HOME
MEMBERS
SERVICE
NEWSLETTER
ELLIOTT SCHOOL
CONTACT
.gif)
.png)
.png)
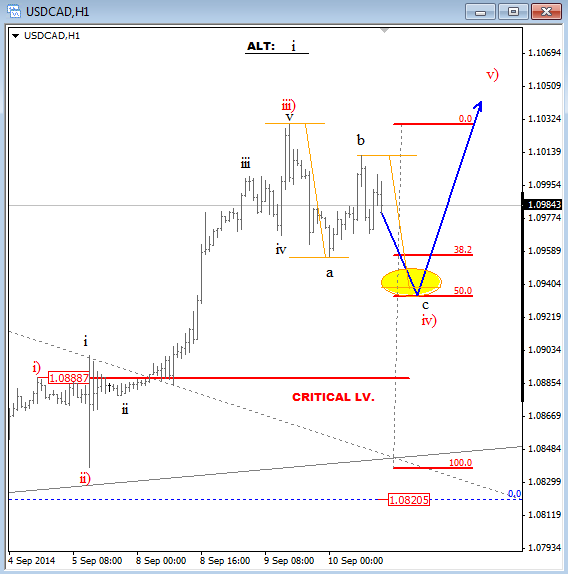
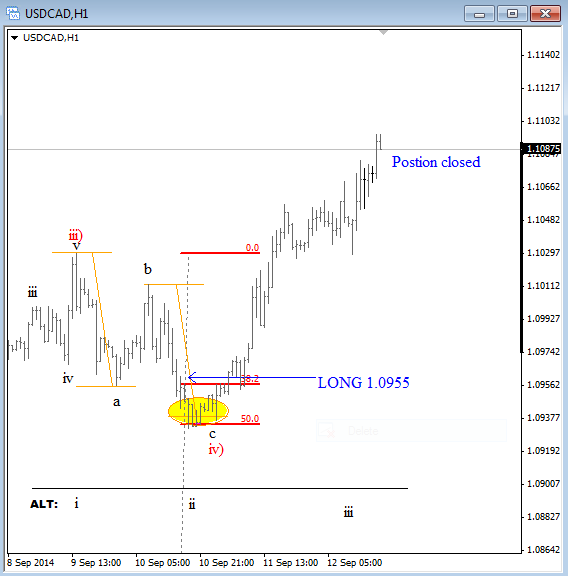
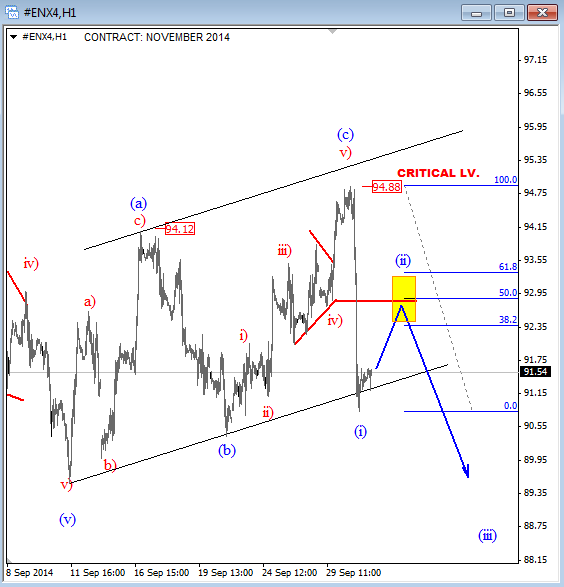
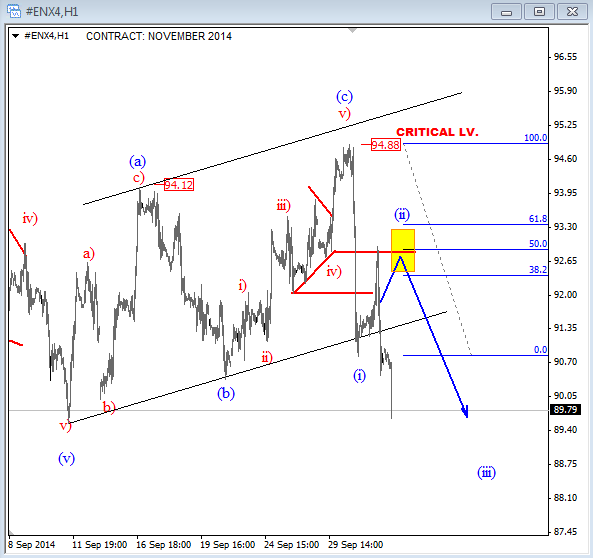
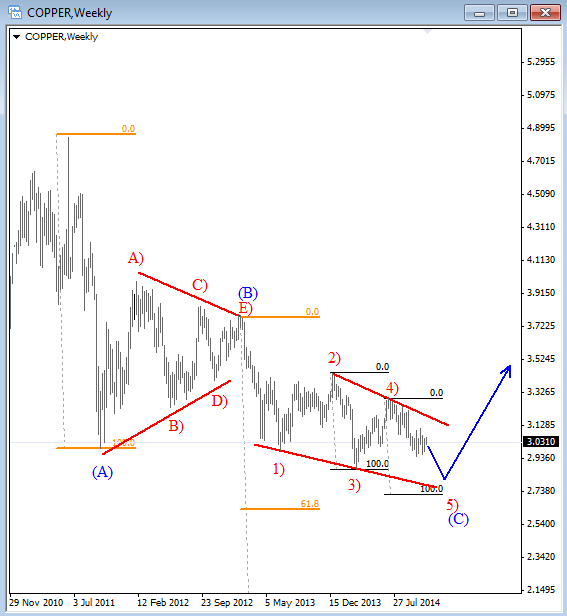
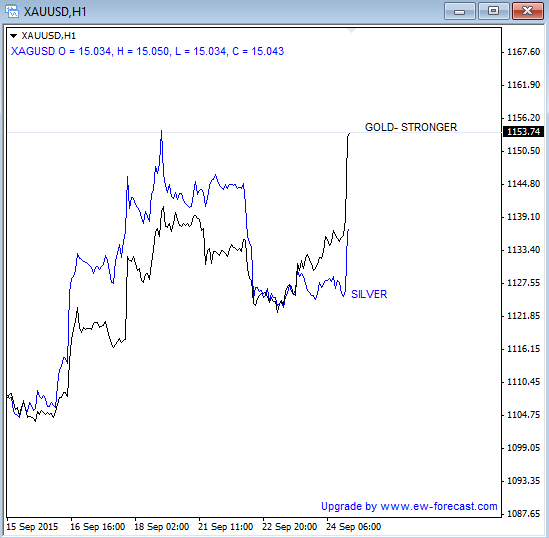
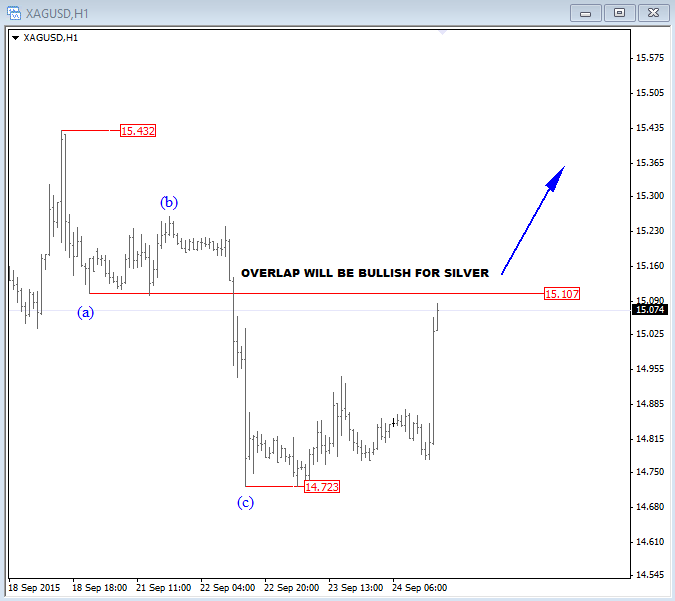
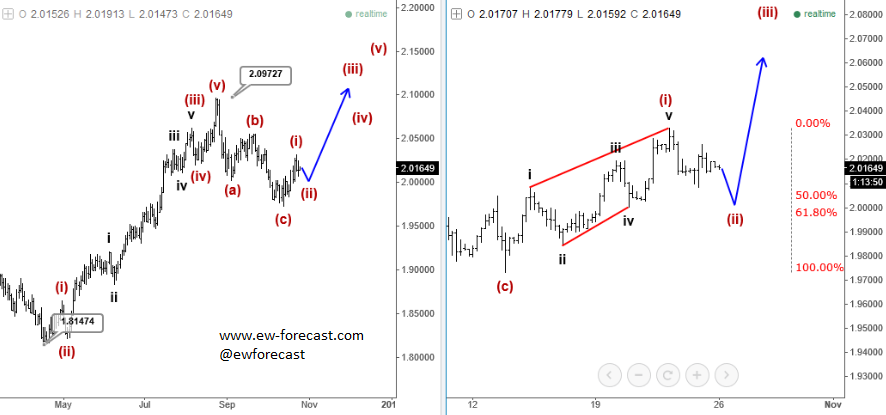
.png)
.png)
.png)
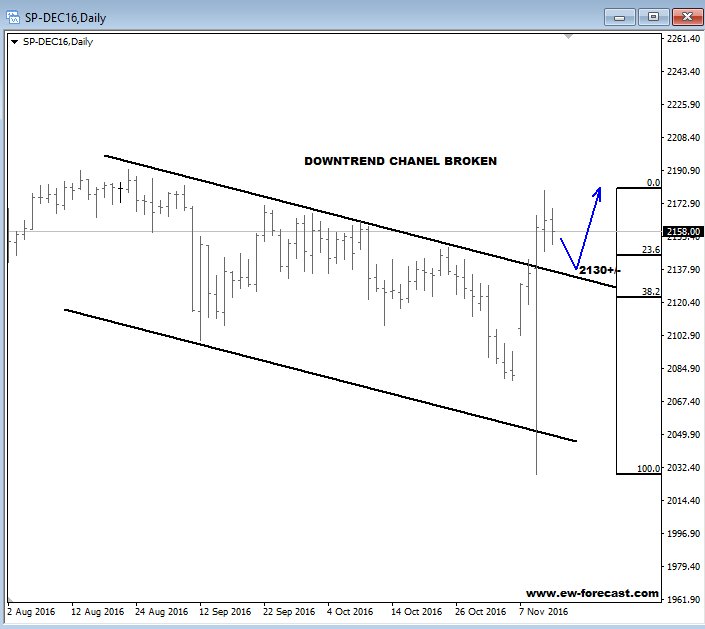
.png)
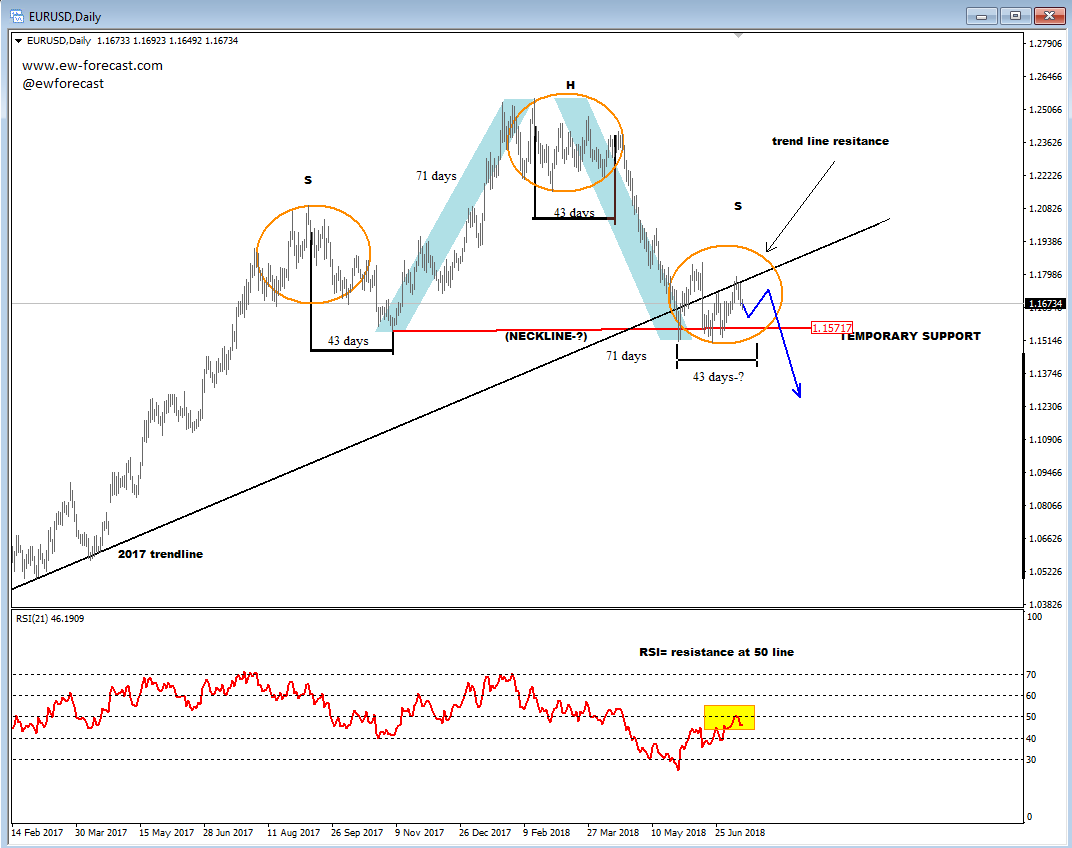

.gif)
.gif)
.gif)
.gif)
.gif)
DISCLAIMER
Any reviews, news, analysis, prices or other information contained on our website is provided as general market commentary and delivered electronically through distribution channel to larger number of clients, therefore does not constitute investment advice or investment research. We are not trading advisors. Most of our work is for educational purposes only, with information based on Elliott Wave theory in real time.
Trading forex, futures, options, stocks, cryptocurrenices or any another trading market carries a high level of risk, and may not be suitable for all investors. The possibility exists that you could lose some or all of your initial investment; therefore you should not invest money that you cannot afford to lose. Our website and the information that we provide should not be relied upon as a substitute for extensive independent research before making your investment decisions. In no event will we be liable for any loss or damage on your account in connection with, the use of our products. For any real cash investments you have to contact your financial advisor.
Any information or material contained on our website is owned by Val Global d.o.o.. Reproduction is prohibited without our permission.
Val Global ltd, Dvorjane 7, 2241 Sp. Duplek, Slovenia
| Members area Newsletter |
Services FAQ |
Terms And Conditions Privacy Policy |
||
©2010 - 2020 ew-forecast.com
Design: VOBI